
Figure 5.
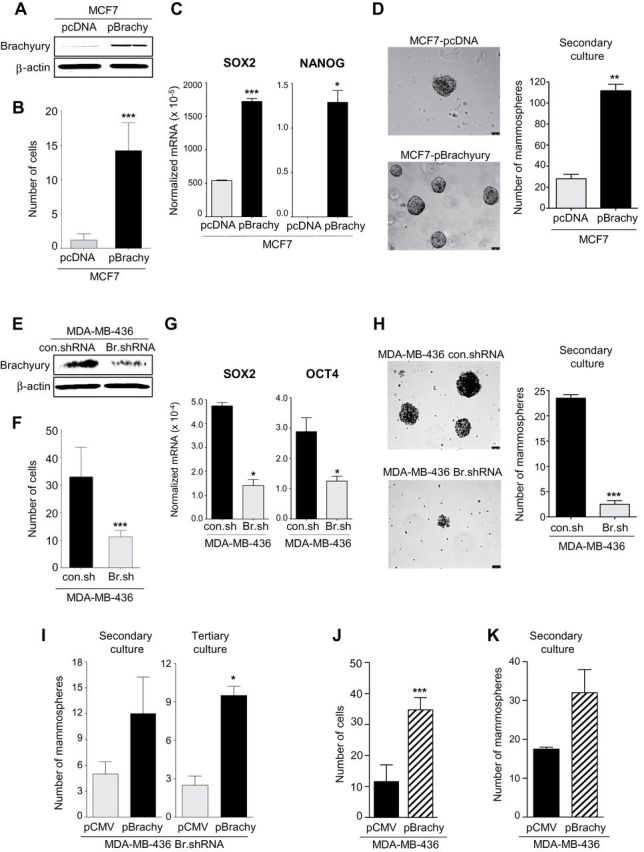
Brachyury promotes invasiveness and mammosphere growth of breast cancer cells. Western blot analysis of brachyury expression in MCF7 cells transfected with a control (pcDNA) vs a full-length human brachyury-encoding vector (A) or MDA-MB-436 cells transfected with a control nontargeting shRNA (con.shRNA) or a brachyury-specific shRNA (Br.shRNA) (E). B and F) In vitro invasion assay conducted with indicated tumor cell pairs. C and G) Real-time polymerase chain reaction analysis of indicated genes in the MCF7 or the MDA-MB-436 tumor cell pair, respectively. Values are expressed as a ratio to the endogenous control GAPDH. D and H) Mammospheres were grown from the MCF7 or the MDA-MB-436 tumor cell pair; bright field images of mammospheres at ×10 magnification (scale bars = 75 μm) and number of mammospheres are shown for secondary cultures in the left and right panels, respectively. I) Number of mammospheres for secondary and tertiary cultures with MDA-MB-436 Br.shRNA cells transfected with a control pCMV vs pBrachyury vector. Invasion assay (J) and number of mammospheres observed with MDA-MB-436 cells transfected with a control pCMV or a pBrachyury vector (K). For invasion assays, bars represent the mean ± standard deviation of at least two identical replicates of a representative dataset from two or more independent experiments. Real-time polymerase chain reaction results are shown as the mean value ± standard deviation of three identical replicates. For mammosphere assays, bars represent the mean ± standard deviation of at least two identical replicates. *P < .05, **P < .005, ***P ≤ .001 by Student t test analysis. All statistical tests were two-sided.