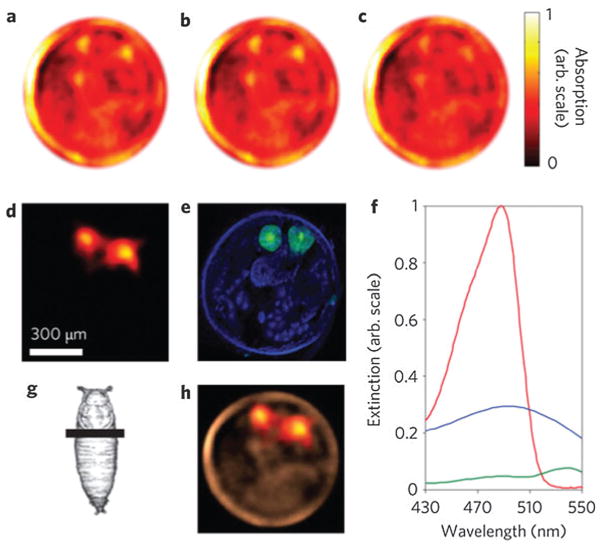
Fig. 42.
PAT of eGFP distribution in Drosophila melanogaster pupa.230 PAT images acquired at (a) 488 nm, (b) 498 nm and (c) 508 nm, respectively. (d) Spectrally resolved PAT image of eGFP distribution in an intact pupa. (e) Corresponding histology of DAPI-stained pupa at the same imaging plane (green color corresponds to GFP-expressing salivary glands). (f) Extinction spectra of eGFP (red with absorption peak at 488 nm) along with measured absorption of pupa case (blue) and fat areas (green). (g) Imaging plane of the pupa. (h) Overlaid image of the image at 508 nm (c) and the spectrally resolved image (d).

