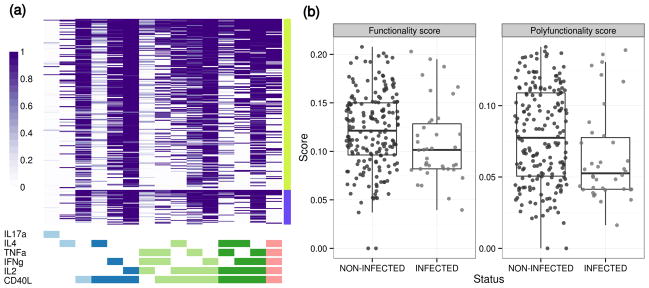
Figure 2.

(a) Heatmap of COMPASS posterior probabilities for the RV144 data set. Columns correspond to the different cell subsets modeled by COMPASS (shown are the 15 of 24 subsets with detectable antigen-specific responses that had >5 cells in >2 subjects), color-coded by the cytokines they express (white=“off”, shaded=“on”, grouped by color=“degree of functionality”), and ordered by degree of functionality from one function on the left to five functions on the right. Subsets with maximum posterior probabilities less than 0.005 are removed from the heatmap. Rows correspond to subjects (only shown are 226 vaccine recipients), which are ordered by their status: non-infected and infected, and by functionality score within each group. Each cell shows the probability that the corresponding cell-subset (column) exhibits an Ag-specific response in the corresponding subject (row), where the probability is color-coded from white (zero) to purple (one). (b) Boxplots of functionality and polyfunctionality scores stratified by HIV infection status in RV144 among 226 vaccine recipients. Non-infected individuals have higher scores than infected ones (Wilcoxon test p = 0.03 (FS), p = 0.01 (PFS). Both scores are inversely correlated with infection (Table 1).
