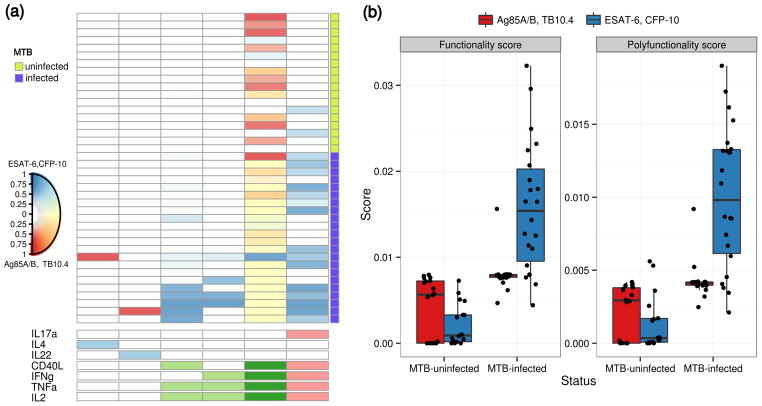
Figure 4.
(a) Heatmap of COMPASS posterior probabilities for the TB data set. Columns correspond to the different cell subsets modeled by COMPASS (shown are the six of 22 and 19 subsets with detectable antigen-specific response that had >5 cells in >2 subjects), color-coded by the cytokines they express (white=“off”, shaded=“on”, grouped by color=“degree of functionality”), and ordered by degree of functionality from one function on the left to five functions on the right. Subsets with maximum posterior probabilities less than 0.1 are removed from the heatmap Rows correspond to 40 subjects, which are ordered by level of interferon-gamma release as measured by Quantiferon Test (QFT). Subjects with positive QFT test results are labeled as TB positive. Each cell shows the probability that the corresponding cell-subset (column) exhibits an Ag-specific response in the corresponding subject (row), where the probability is color-coded from white (zero) to blue (one) for MTB-specific stimulation and red (one) for MTB-non-specific. A mix of blue and red (i.e. yellow) indicate a response to both stimulations. (b) Boxplots of functionality and polyfunctionality scores stratified by TB positive and TB negative for both TB-specific and non TB-specific stimulations.

