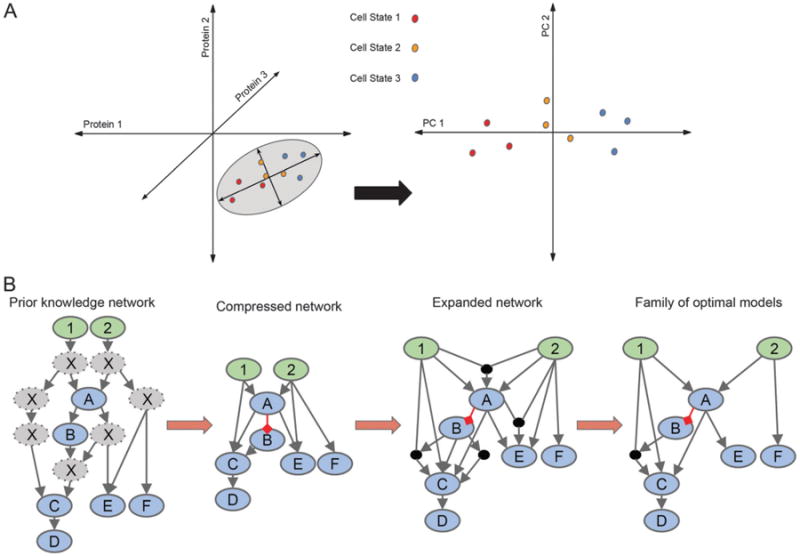
Fig. 3.

Quantitative modeling of multidimensional data. (A) Principal component analysis can be used for interpreting multivariate data by reducing dimensionality. In this simple example, cells are plotted (left plot) in 3D according to expression levels of three proteins. The grey ellipse encircles the axes that contain the most variation in the data, the principal components. The data aligned to the principal components in 2D (right plot) allows for easier visualization of the difference(s) in the data. In this case, the three cell states are more easily identified. (B) Logic-based modeling can be used for constructing a family of optimal models from a prior knowledge network (PKN) with a given set of inputs (green nodes) and observables (blue nodes). The PKN is compressed by removing all unobservables (grey nodes) while maintaining connectivity of nodes downstream. Grey arrows represent activation, while red arrows represent inhibition. To allow for all possible connections, the network is expanded. A family of optimal models is derived using experimental data.
