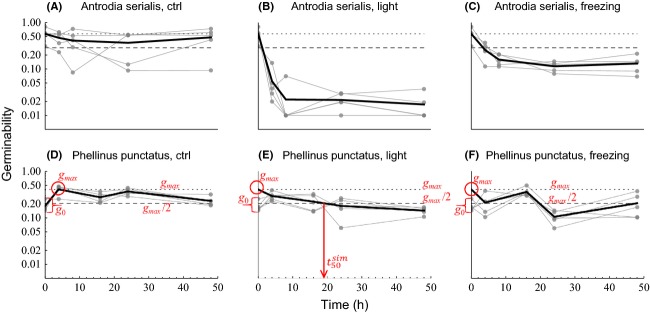
Figure 2.

The change in germinability over time (h) in the control (dark at 25°C; A, D), light (simulated sunlight at 25°C; B, E), and freezing (dark at -25°C; C, F) treatments shown here for two example species with contrasting responses (Antrodia serialis, A-C; Phellinus punctatus, D-F) and for all examined species in Appendix S2, Fig. S1. The gray points connected by each thin gray line show the germinability of spores from one sampled individual in the course of the treatment, with the value at time 0 showing the initial germinability g0 (i.e., germinability without treatment). The thick black line is the mean germinability in each treatment, averaged over the different individuals. The horizontal dotted and dashed lines show, respectively, the maximal (gmax) and 50% of the maximal (gmax/2) mean germinability observed in the control treatment. In the control treatment, mean germinability at time 0 is defined as the mean initial germinability (g0); in the freezing and light treatments, mean germinability at time 0 is defined as gmax. The first intersection point of the mean germinability and gmax/2 was used as an estimate for the half-life of the spores under the light treatment  . To clarify the different measures, g0, gmax, gmax/2, and
  are marked in the panels for P. punctatus (D–F) with red labels; note that the former three measures are identical in all three panels.
