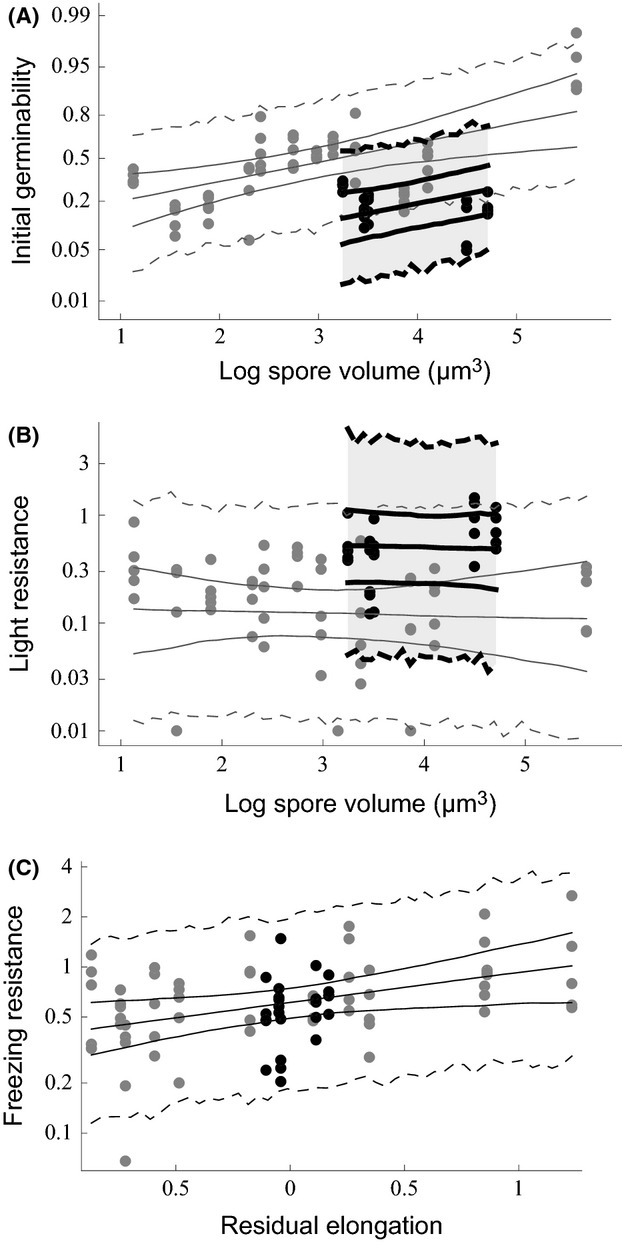
Figure 4.

The effects of spore traits on initial germinability (A) and light (B) and freezing resistance (C) of spores. Each point corresponds to spores from a fruit body growing on a separate trunk, that is, to a fungal individual. The lines show the median and 95% credibility intervals of the HCM, including parameter uncertainty only (solid lines) or also random variation among species and individuals (dashed lines). Black points and thick black lines: species with thick-walled spores; gray points and lines: species with thin-walled spores. In the plotted model predictions, those spore traits whose effect is not illustrated were always assumed to have the mean trait value over all species.
