
Figure 2.
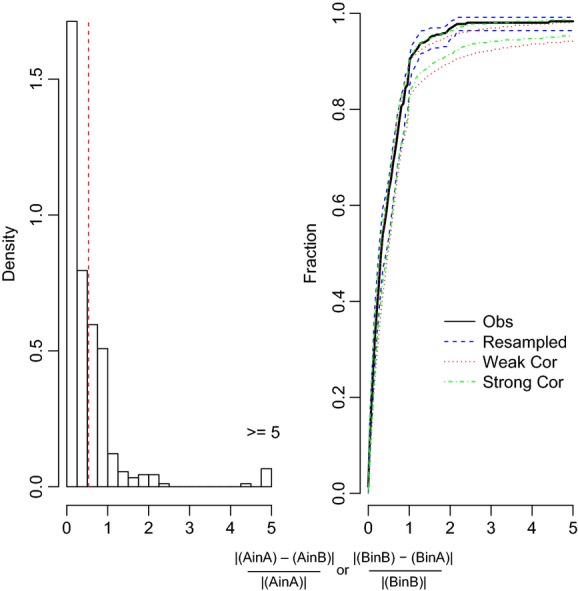
Histogram and cumulative distribution function for population trait pairs indicating plastic versus not plastic. Population trait pairs with values below the threshold (0.53, indicated by the dashed vertical line in the histogram) for both traits were categorized as not plastic.