
Figure 3.
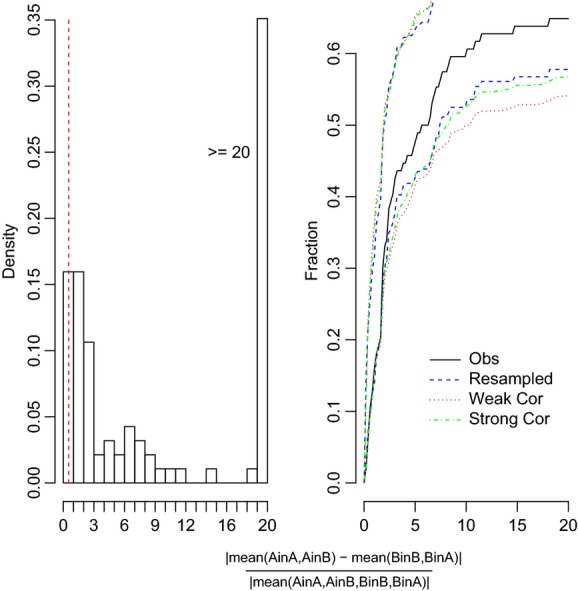
Histogram and cumulative distribution function for nonplastic trait pairs with canalized response–no differentiation versus canalized response–population differentiation. Population trait pairs with values below the threshold (0.53, indicated by the dashed vertical line in the histogram) were categorized as canalized response–no differentiation.