Figure 5.

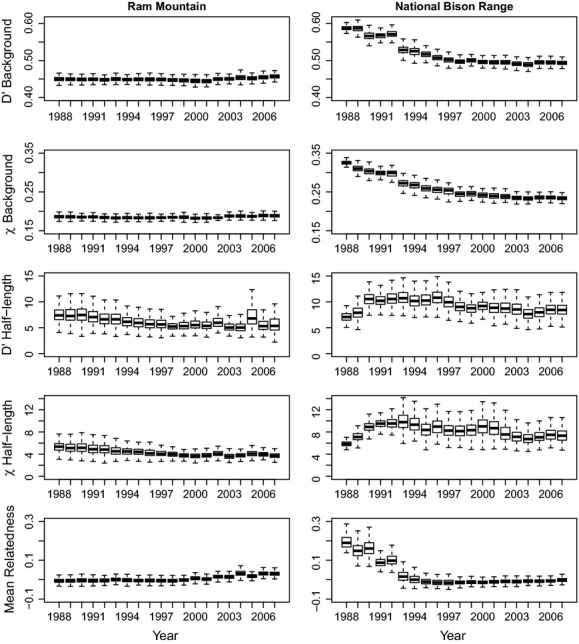
Box plots of temporal variation in background LD, half-lengths, and relatedness in RM and NBR. Yearly estimates were obtained by subsampling 20 individuals 500 times. Errors bars show SD from 500 bootstraps.

Box plots of temporal variation in background LD, half-lengths, and relatedness in RM and NBR. Yearly estimates were obtained by subsampling 20 individuals 500 times. Errors bars show SD from 500 bootstraps.