
Figure 4.
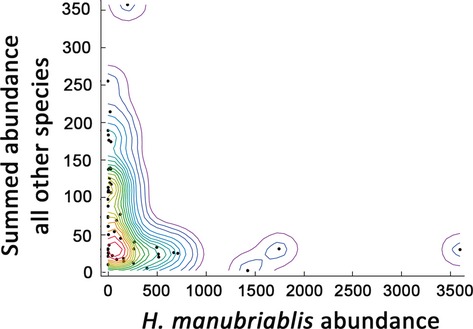
Relationship between the abundance of H. manubrialis and of all other species combined in each litter cage at the second sampling date. The lines indicate 5% quantiles using the Nonparametric Bivariate Density plot function (JMP 8 for Macintosh; SAS Institute). The relationship is significantly negative (Spearman rank correlation, rs = 0.40, P = 0.0037).