Figure 2.

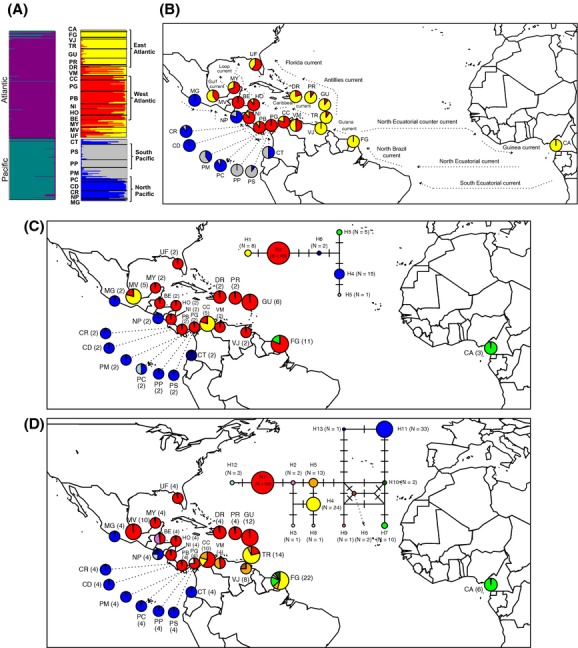
Genetic structure across 26 sites of Rhizophora mangle in the Neotropics using nuclear microsatellite polymorphisms (A and B) and median-joining networks based on haplotype polymorphisms for two chloroplast genes (C) and one flanking microsatellite region (FMR) (D). (A) Structure analysis based on microsatellite polymorphism for the entire set of sampling locations (i.e., Neotropics) (best K = 2) and grouping of the sampling locations by ocean basin inferred (i.e., Atlantic, best K = 2 and Pacific, best K = 2). (B) The map shows the proportion of assignment for each of the sampling locations to inferred clusters within each ocean basin and the main ocean currents that surround each sampling locality. (summarized from Gordon 1967, Kessler 2006, Lee et al. 1996, Oey et al. 1985, Richardson and Walsh 1986, Schott and Zantopp 1985, Stramma and Schott 1999 and Wüst 1964) (C) The inferred median-joining networks for cpDNA loci (atpI-atpH and psbJ-petA) and (D) for the FMR regions (RM11). For each network, the proportion of haplotypes found in each sampling location and the number of sequences analyzed (in parenthesis) by sampling locality is also indicated (see Appendix S1 for the acronyms of each sampling locations).
