Figure 2.

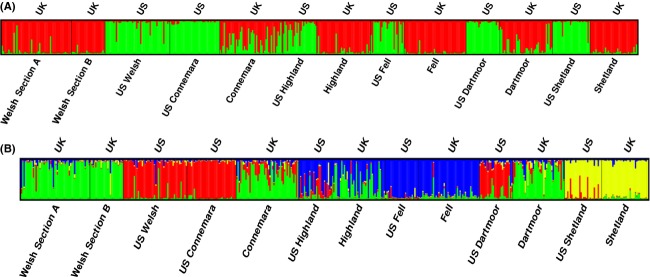
The results of STRUCTURE analysis for 10 SSR loci of each population for (A) K = 2 and (B) K = 4, averaged over six independent runs. STRUCTURE Harvester analysis suggests true value of K was 2 and 4.

The results of STRUCTURE analysis for 10 SSR loci of each population for (A) K = 2 and (B) K = 4, averaged over six independent runs. STRUCTURE Harvester analysis suggests true value of K was 2 and 4.