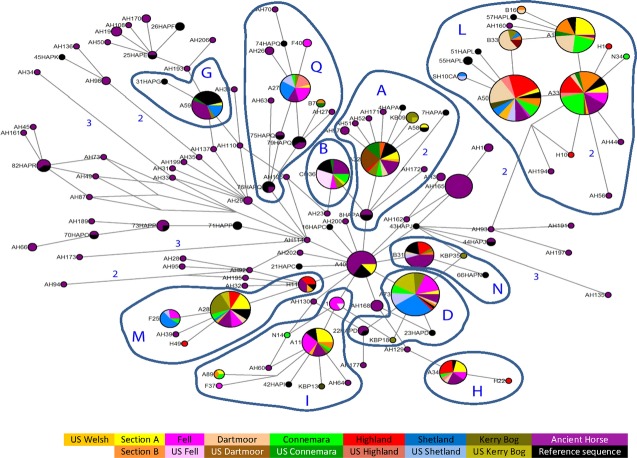
Figure 3.
A median-joining network for mtDNA haplotypes displaying the relationships of the maternal lines of the British, Irish, and U.S. pony populations according to shared mitochondrial haplotype frequencies. Node size represents overall haplotype frequency with pie charts within nodes showing frequency of that haplotype by population. Reference samples representing examples of each of the major haplogroups identified by (Achilli et al. 2012) are displayed in black and labeled according to sample number and haplogroup, for example, “1HapA” Numerical values indicate the number of nucleotide changes (>1 mutation) between primary nodes. The haplotype designated as A40 is placed most ancestrally relative to the entire dataset and contains ancestral samples.

