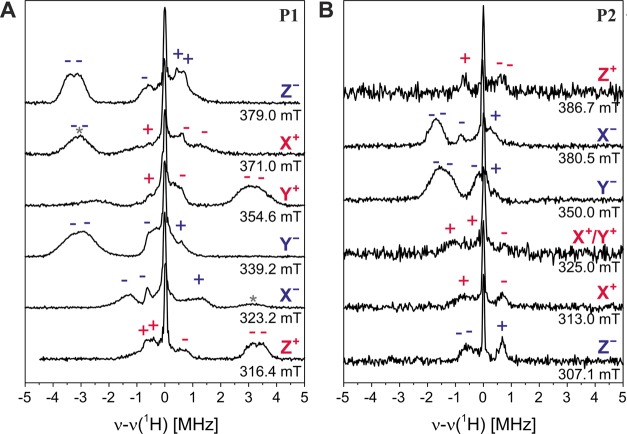
Figure 4.
Experimental Mims ENDOR spectra of the porphyrin monomer (P1, A) and dimer (P2, B) recorded at the canonical field positions at 20 K. The signs of the hyperfine coupling constants of the mS = 0 → mS = +1 (red) and the mS = −1 → mS = 0 (blue) transitions are shown above the corresponding ENDOR peaks. The asterisks denote ENDOR peaks arising from residual contributions of other orientations (e.g., Z– contribution to X+).

