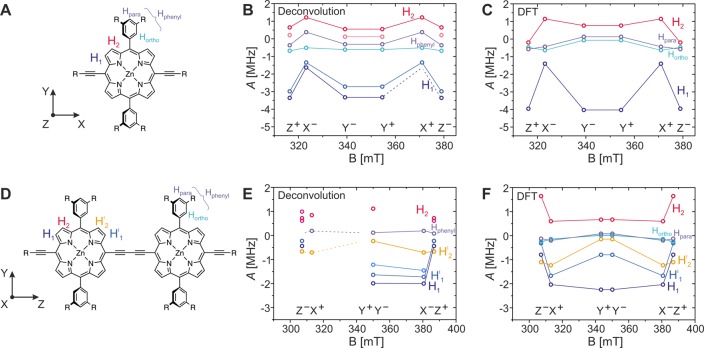
Figure 5.
Comparison of frequency-field plots determined by Gaussian deconvolution of the Mims ENDOR spectra shown in Figure 4 with those predicted by B3LYP/EPRII calculations for P1 (A–C) and for P2 (D–F). The hyperfine couplings determined from the positions of the peaks in the ENDOR spectra are plotted as circles in B and E for P1 and P2, respectively. The hyperfine couplings were tentatively assigned to different protons in the molecule (numbered and color coded as indicated in A and D) on the basis of the comparison with predictions from DFT calculations (shown in C and F for P1 and P2, respectively). The orientation of the ZFS tensor with respect to the molecular structure of P1 and P2 is shown next to the molecular structure in A and D, respectively. The solid lines connect hyperfine couplings assigned to the same type of proton. In some cases, not all of the hyperfine peaks expected on the basis of symmetry could be clearly determined by deconvolution of the experimental data, and the known hyperfine couplings are connected to the positions of the expected hyperfine couplings by dashed lines. No definite assignment of the ortho and para protons on the phenyl rings was possible on the basis of the experimental data, and the corresponding experimental hyperfine couplings are simply denoted as Hphenyl.

