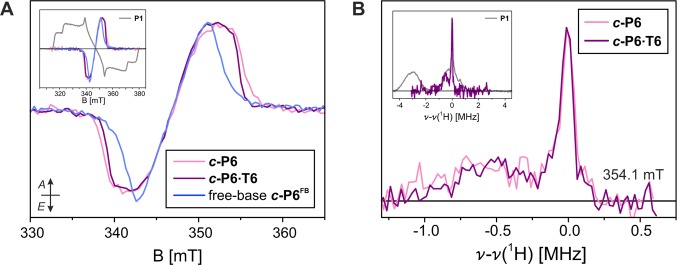
Figure 8.

(A) Transient EPR spectra recorded at 20 K for c-P6, c-P6·T6, and free-base c-P6. The spectra are compared to the EPR spectrum of P1 in the inset. (B) Mims ENDOR spectra recorded at 20 K at a magnetic field of 354.1 mT (high-field Z transition) for c-P6 and c-P6·T6. The spectra are compared to the ENDOR spectrum of P1 (high-field Y position, corresponding to the same molecular orientation along the phenyl rings) in the inset.
