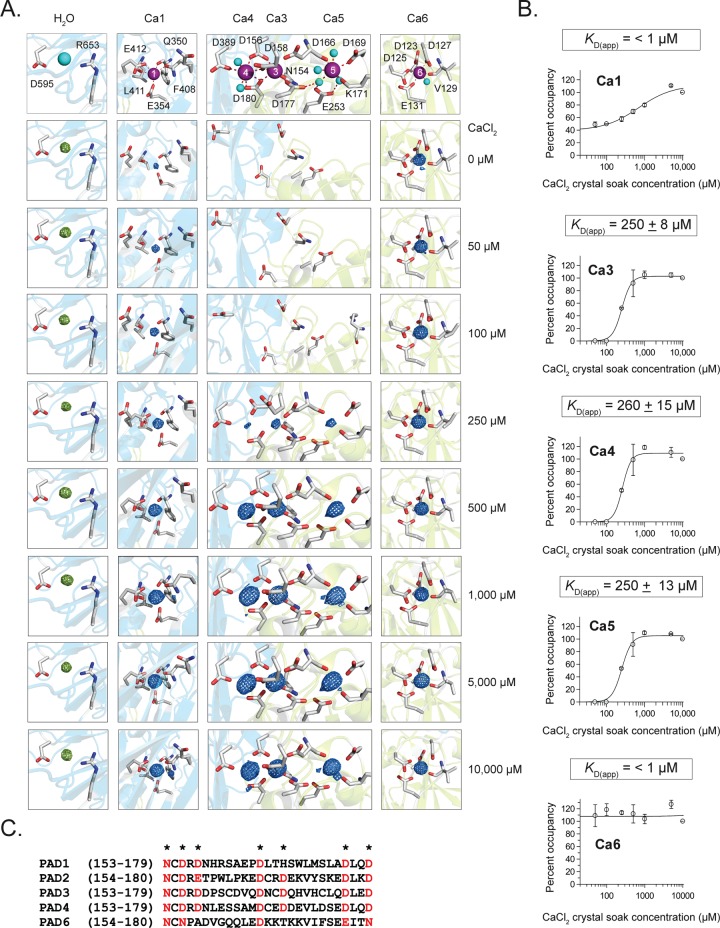
Figure 2.
Calcium-titration experiments by X-ray crystallography. (A) Calcium coordination at the Ca1, 3, 4, 5, and 6 sites. Electron density for calciums 1, 3, 4, 5, and 6 were generated from Fo–Fc omit maps from structures soaked in 0, 50, 100, 250, 500, 1000, 5000, and 10 000 μM Ca2+, corresponding to PDB IDs: 4N20, 4N22, 4N24, 4N25, 4N26, 4N28, 4N2A, and 4N2B, respectively. Density was contoured at the 8σ level from Fo–Fc omit maps where calcium was removed and simulated annealing was performed during refinement. The electron density of each calcium was normalized to a water molecule that was present in all structures and whose density was not affected by soaking with calcium. (B) Calcium dissociation constants (KD(app)) were determined by calculating the percent occupancy of calcium from the e/Å3 levels for each calcium at eight different soak concentrations, and two structures were solved at each soak concentration for data acquisition (n = 2 for each data point). (C) Sequence alignment of the PADs shows the conserved calcium binding residues (*) in the calcium switch. This region is highly conserved (red) among the PADs except for PAD6, which shows no enzymatic activity.

