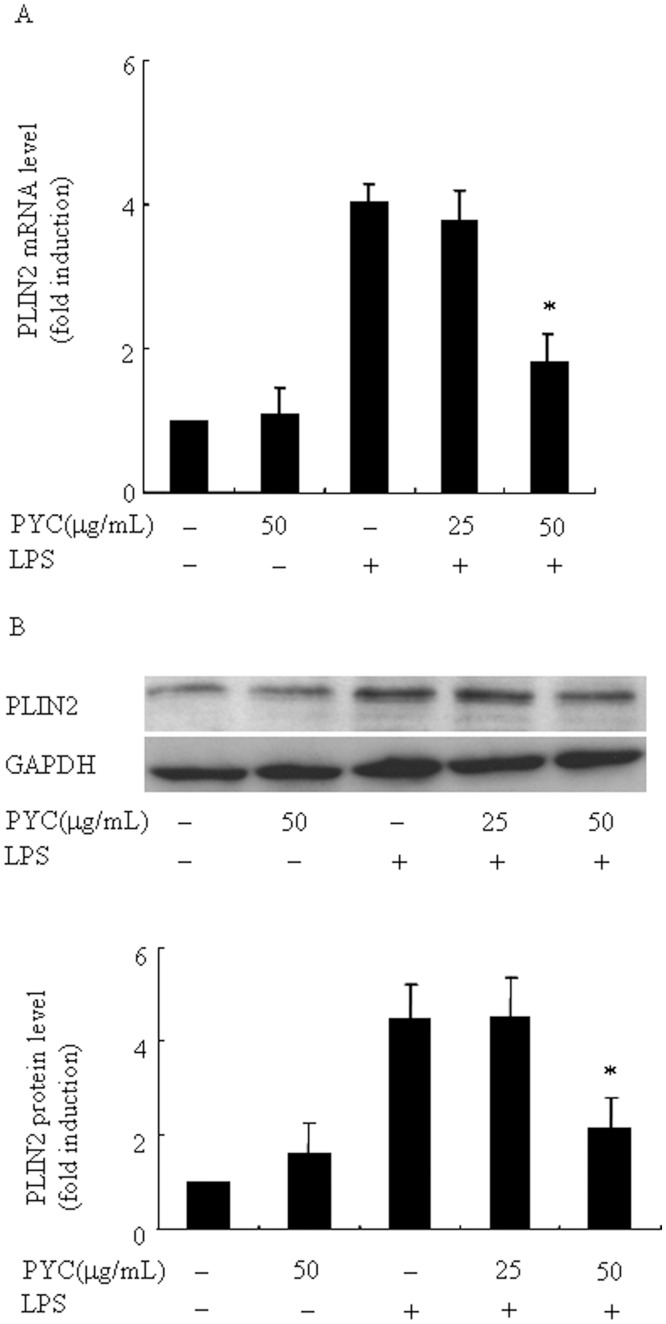
Fig 7. Pre-incubation of different doses PYC suppressed LPS-induced PLIN2 expression in BV2 microglia.
Cells were incubated with the indicated concentrations of PYC or vehicle for 1h before 24 h LPS treatment (500ng/mL). Ribosomal RNAs and GAPDH were used as the total RNA or protein loading control, respectively. (A) PLIN2 mRNA was assessed by real-time PCR, and the mRNA level in the control (no stimuli) was arbitrarily designated as 1 for comparison. (B) Levels of PLIN2 protein were assessed via Western blot. Levels of PLIN2 protein were quantified by the NIH Image processing and analysis program. *P< 0.05 compared with LPS alone. #P< 0.05. Representative data are shown. Relative mRNA and protein levels obtained from 3 independent experiments are shown in bar graphs.

