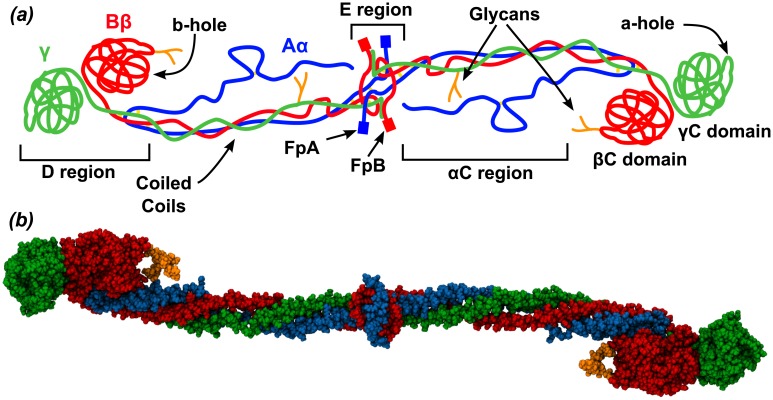
Fig 1. The fibrinogen molecule.
(a) Schematic representation of the fibrinogen molecule. The three chains of Fg, Aα, Bβ and γ are shown in blue, red and green, respectively. (b) Van der Waals representation of the crystallographic structure (pdb 3GHG) of Fg, color coded as in (a). Carbohydrates are in orange. The αC region and the FpA and FpB peptides were not resolved in the crystal structure.

