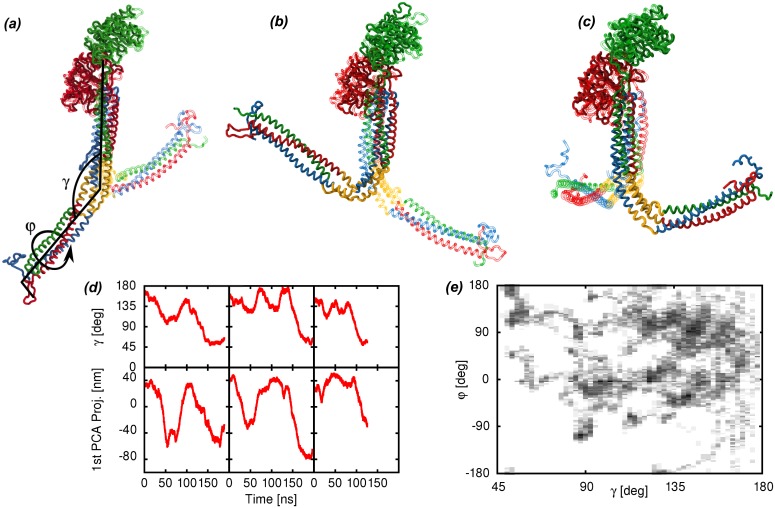
Fig 2. Characterization of the large bending motions of fibrinogen.
(a)–(c) Dominant PCA modes of the Fg protomer with the hinge region highlighted in yellow (chains colored according to Fig 1). For each PCA mode, the two structures with the largest (solid) and smallest (transparent) projection along the PCA mode are represented. An illustration of the bending angle γ and the torsion angle φ is superimposed to the first PCA mode. The three groups of atoms used to define the γ angle are the E region (α50–58, β82–90, γ23–31), the hinge region (α99–110, β130–155, γ70–100) and the D region (β200–458, γ140–394). The four groups of atoms used to define the φ are one part of the E region (α50–58, γ23–31), another part of the E region (β82–90, γ23–31), the hinge region (α99–110, β130–155, γ70–100) and the D region (β200–458, γ140–394)(d) Time series of the γ angle and of the projection of the trajectories along the first PCA component from selected simulation runs. The plots show both the reversibility of the motion and the time scale along which it occurs. (e) Distribution of the bending angle γ and dihedral angle φ around the hinge of the Fg protomer as observed in the present simulations. The elongated conformation of Fg observed in the crystals correspond to a γ angle close to 160°.

