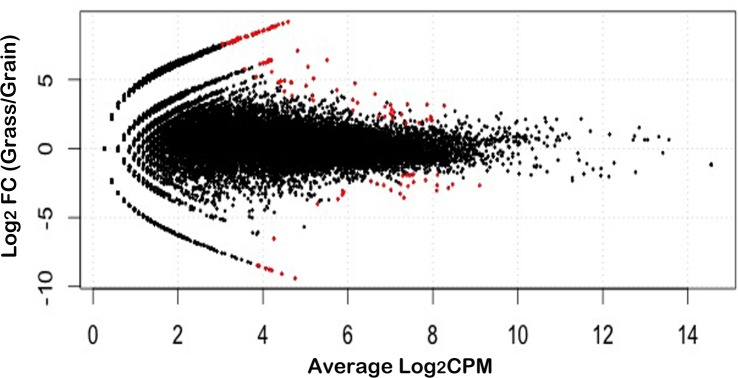
Fig 2. Differentially expressed spleen genes between grass-fed and grain-fed steers.

MA-plot was obtained from two independent biological replicates at an FDR of 0.1. The black points represent the genes without expression difference. FC means fold-change. CPM means counts per million.
