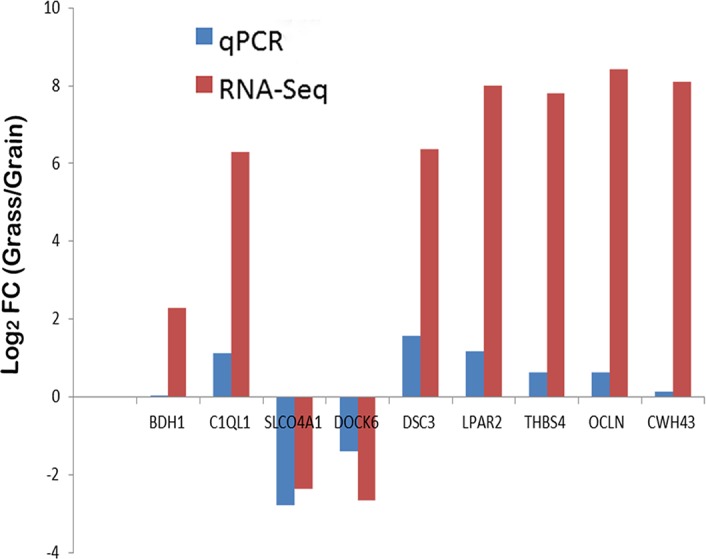
Fig 3. Validation of differentially expressed genes.

The mean value of log2 (fold-change) for each group was compared in the bar chart for the 9 selected genes. qPCR data was normalized by GAPDH expression for each sample. Means of significant (FDR≤0.1) fold changes were computed for qPCR and DESeq using sample from the same 4 animals in each analysis. FC means fold-change.
