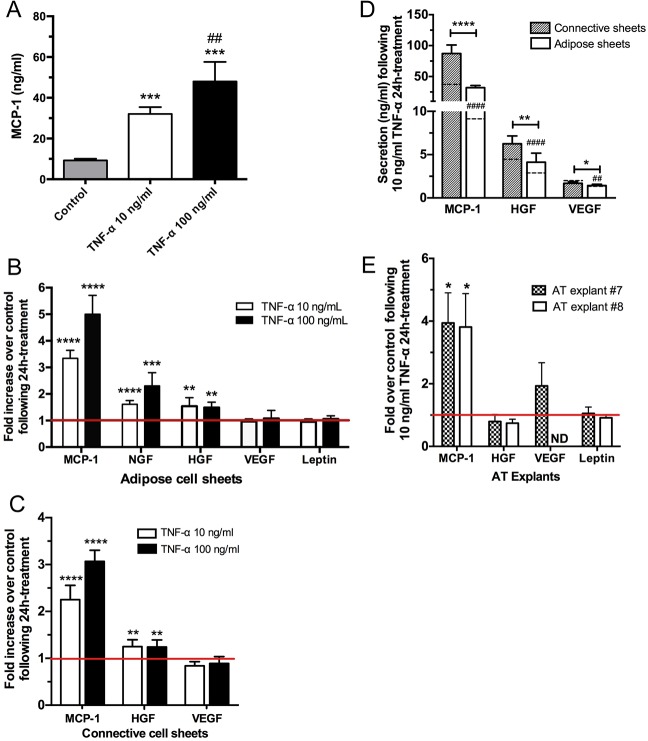
Fig 4. Effects of TNF-α on adipokine secretion by reconstructed tissues and AT explants.
(A) Dose-dependent release of MCP-1 after exposure to TNF-α. Adipose cell sheets were incubated for 24 h in presence of 10 or 100 ng/ml of TNF-α and the conditioned media were analyzed by ELISA assays. One-way ANOVA followed by Tukey’s post-hoc test. ***P≤0.001 compared to control, ## P≤0.01 compared to 10 ng/ml TNF-α. (B) Fold increase protein expression over control for MCP-1, free NGF, HGF, VEGF and leptin following a 24 h exposition of adipose sheets to 10 or 100 ng/ml TNF-α. (C) Fold increase protein expression over control for MCP-1, HGF and VEGF following a 24 h exposition of connective sheets to 10 or 100 ng/ml TNF-α. For each molecule, one-sample t-tests were performed in reference to untreated sheets (ratio of 1). For B and C, One-way ANOVA followed by Dunnett’s post-hoc test ****P≤0.0001, ***P≤0.001, **P≤0.01. (D) Comparative amounts (ng/ml) of MCP-1, HGF and VEGF secreted by the connective and adipose cell sheets following a 24 h exposure to 10 ng/ml TNF-α. Dashed lines within each column indicate the basal level of mock-treated connective and adipose sheets for the corresponding secreted protein. # indicates statistical significance for these basal levels between connective and adipose sheets while asterisks (*) indicate significance between tissue types. ****P≤0.0001, **P≤0.01, *P≤0.05. Note that leptin is not produced by connective sheets or hrCT. (E) Fold increase protein expression over control for MCP-1, HGF, VEGF and leptin following a 24 h exposition of human AT explants to 10 ng/ml TNF-α. Data normalization was performed according to the weight of the explants.

