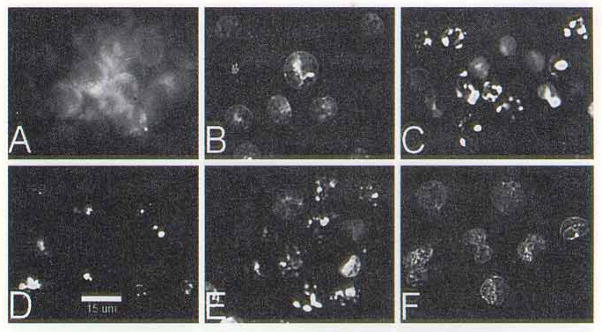
Figure 2.

Localization of SnOPA (A) and SnET2 (D); resulting patterns of nuclear apoptotic response (detected by HO342 staining) at 1 and 24 h after LD50 PDT doses with SnOPA (1 h = B, 24 h = C) and SnET2 (1 h = C. 24 h = F). The white bar at the bottom of panel D = 15 μm.
