
Figure 1.
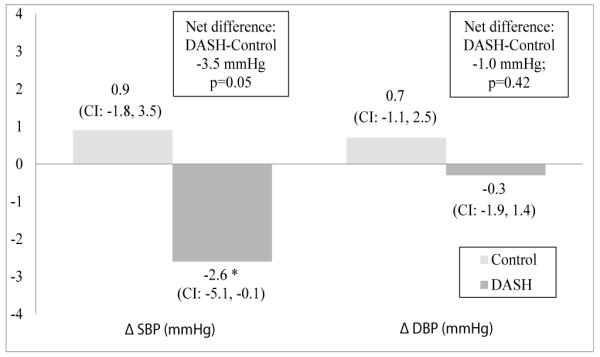
Change in blood pressure for 89 participants of the DASH-Sodium trial by diet assignment after a 4-week feeding intervention. General linear models were adjusted for site, intervention period, baseline blood pressure, estimated glomerular filtration rate, race, gender, age and body mass index. Between group difference (DASH minus Control) and p-values are offset in boxes. *p=0.02. Sample size is 42 for control and 47 for DASH (minus 3 participants with missing pre- or post-intervention BP). SBP, systolic blood pressure; DBP, diastolic blood pressure; CI, 95% confidence interval; diff, difference.