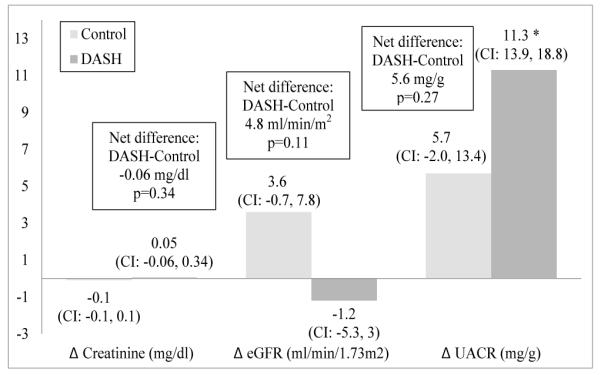
Figure 3.

Change in kidney function for 92 participants of the DASH-Sodium trial by diet assignment after a 4-week feeding intervention. General linear models were adjusted for site, intervention period, baseline eGFR, and each respective baseline value (creatinine, eGFR, UACR). Between group difference (DASH minus Control) and p-values for participants with both preand post-intervention plasma or urine samples are offset in boxes. Sample sizes for creatinine, eGFR and UACR were 81 (control 38, DASH 43), 87 (42 control, 45 DASH), and 72 (34 control, 38 DASH), respectively. eGFR, estimated glomerular filtration rate; UACR, urine albumin-to-creatinine ratio; CI, 95% confidence interval; diff, difference.
