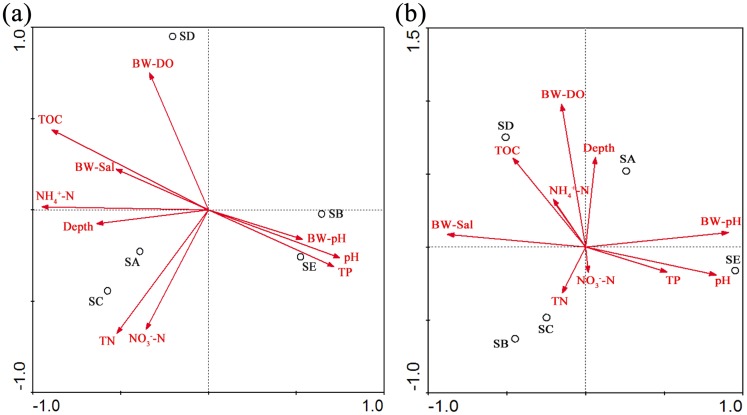
Fig 4. RDA ordination plots show the correlation between the M. oxyfera-like bacteria community structure and environmental factors using the 16S rRNA (a) and pmoA (b) gene sequences from Yellow River Estuary sediments.
The correlations between the environmental factors and RDA axes are represented by the length and angle of the arrows. Depth: depth of the overlying water, TN: total nitrogen, TP: total phosphorus, NH4 +-N: ammonium, NO3 −-N: nitrate, TOC: total organic carbon, BW: bottom water, Sal: salinity, and DO: dissolved oxygen.

