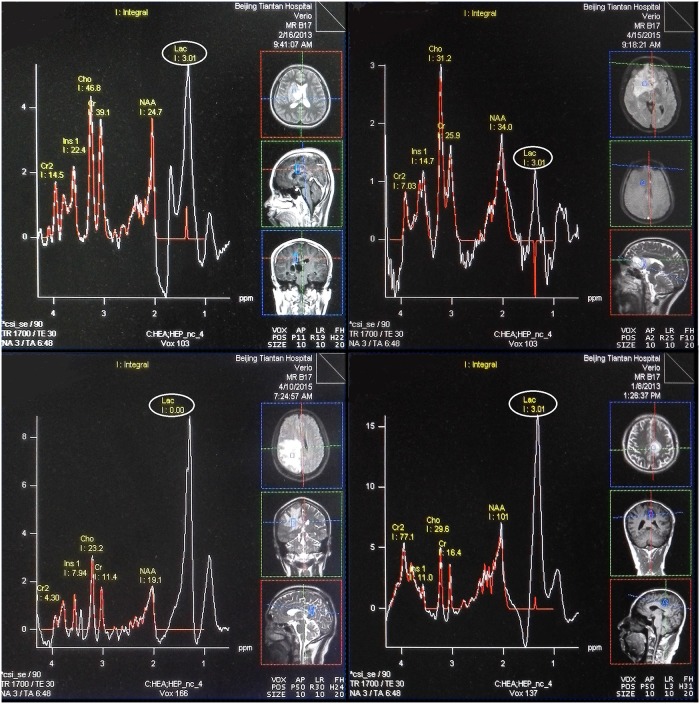
Fig 2. Samples of spectroscopy processed by Siemens processing software with LL quantification error.
All the chosen spectroscopies belong to tumoral area. The quantification results are presented in red line, and these errors should be found at the location of Lac point by comparing with original spectrum (white line).

