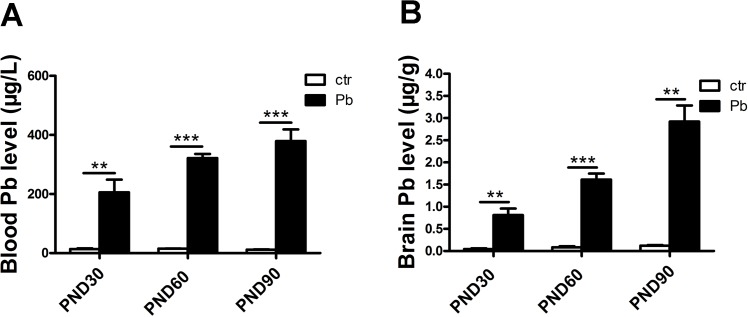
Fig 2. Pb accumulation in blood and brain in both control and Pb-exposed rats.
Blood Pb levels in control and Pb-exposed rats at PND30, PND60 and PND90 (A). Brain Pb levels in control and Pb-exposed rats at PND30, PND60 and PND90 (B). Data are expressed as mean ± SEM. **P<0.01, ***P<0.001, n = 8 per group.

