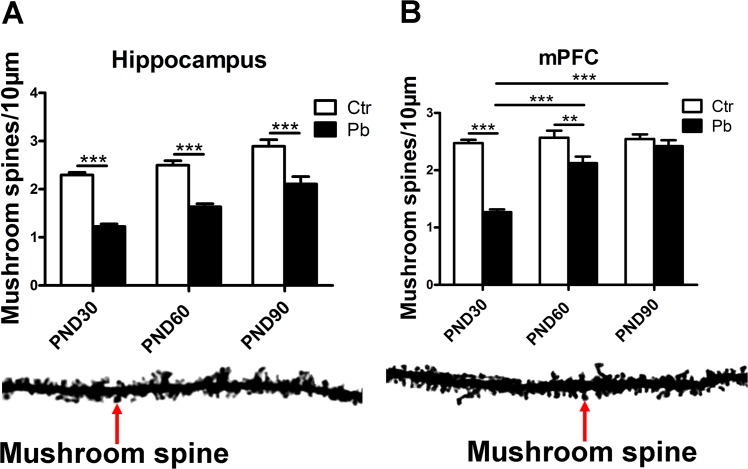
Fig 5. Effect of chronic Pb exposure on dendritic mushroom spines in rat brain with brain regions differences and age differences.
The number of mushroom spines in hippocampal neurons at PND30, PND60, PND90, respectively (A). The number of mushroom spines in mPFC at PND30, PND60, PND90, respectively (B). Blow the histogram: dendritic spines stained with the Golgi-cox (Scale bar = 10μm). Data are expressed as mean ± SEM. **P<0.01, ***P<0.001. Scale bar = 10μm. n = 16 per group.

