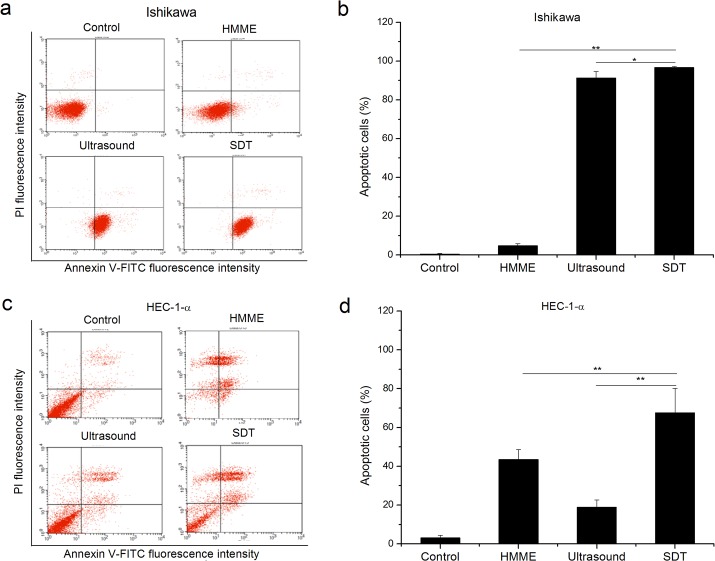
Fig 4. Analysis of apoptosis rate of endometrial cancer cells using flow cytometer.
The apoptosis levels are much higher in SDT groups than the control, HMME or ultrasound groups in Ishikawa (a and b) and HEC-1-a (c and d) cells. Representative FACS profiles were shown in a and c. Histograms present mean ± SD of three independent experiments (b and d, * P < 0.05; ** P < 0.01.)

