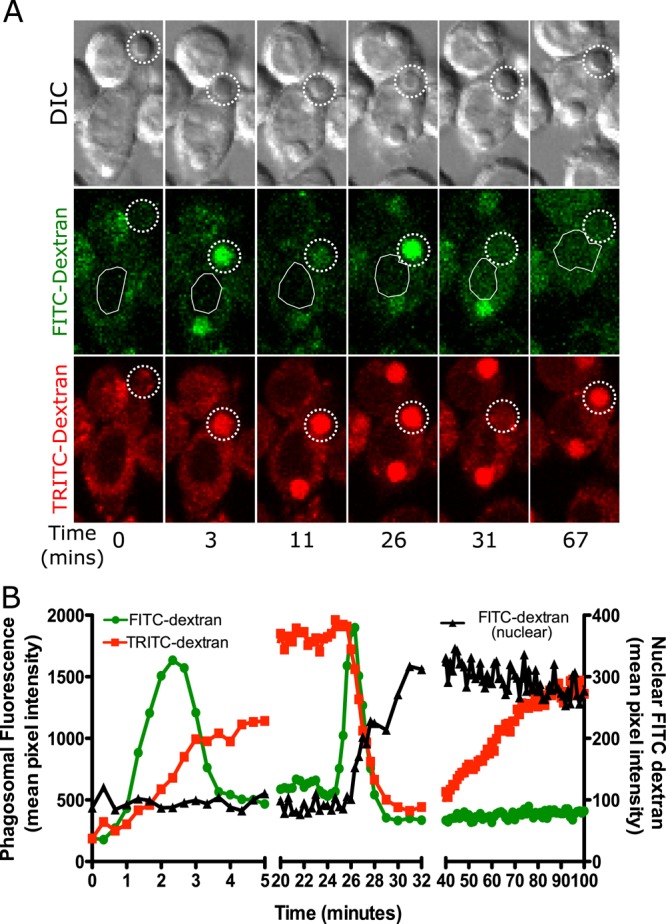
FIGURE 1:

Phagosomes containing amorphous silica particles transiently leak some of their contents to the cytoplasm. (A, B) MH-S alveolar macrophages were loaded with 4-kDa FITC dextran and 4-kDa TRITC dextran for 2.5 h and then exposed to 20 μg/cm2 amorphous, opsonized, 3-μm silica particles. Images were captured through the volume of the cell in 2-μm intervals every 20 s. A plane in which a particle was in focus is shown. (A) In this sequence of images, the particle was phagocytosed and then the phagosome fused with endolysosomes, resulting in an increase in phagosomal fluorescence for both FITC-dextran and TRITC-dextran, as indicated by dotted circle throughout the data set (3 min). FITC-dextran is pH sensitive, and hence, upon acidification, the fluorescence decreased (11 min). On phagolysosome leakage, FITC-dextran fluorescence initially increased due to the influx of cytoplasm (26 min), followed by a decrease in fluorescence due to leakage into the cytoplasm (31 min). This leakage is detected as FITC-dextran signal appearing in the nuclear area of the cell, indicated by a white outline. The TRITC-dextran fluorescence initially continuously increased since it is not affected by the pH change (3–26 min). At the same time that leakage of FITC-dextran occurred, the phagosomal TRITC-dextran fluorescence also rapidly decreased, indicating leakage into the cytoplasm (31 min). This signal was harder to measure in the nuclear area due to signal from the rest of the cytoplasm contributing to nuclear background noise. The TRITC-dextran fluorescence then began to gradually increase beginning at 40 min, presumably due to resealing of the phagosome and continued endosomal fusion. (B) Quantification of data for the cell in A showing data from phagosomal TRITC-dextran and FITC-dextran as well as nuclear FITC-dextran. The trends seen are representative of 20 cells examined.
