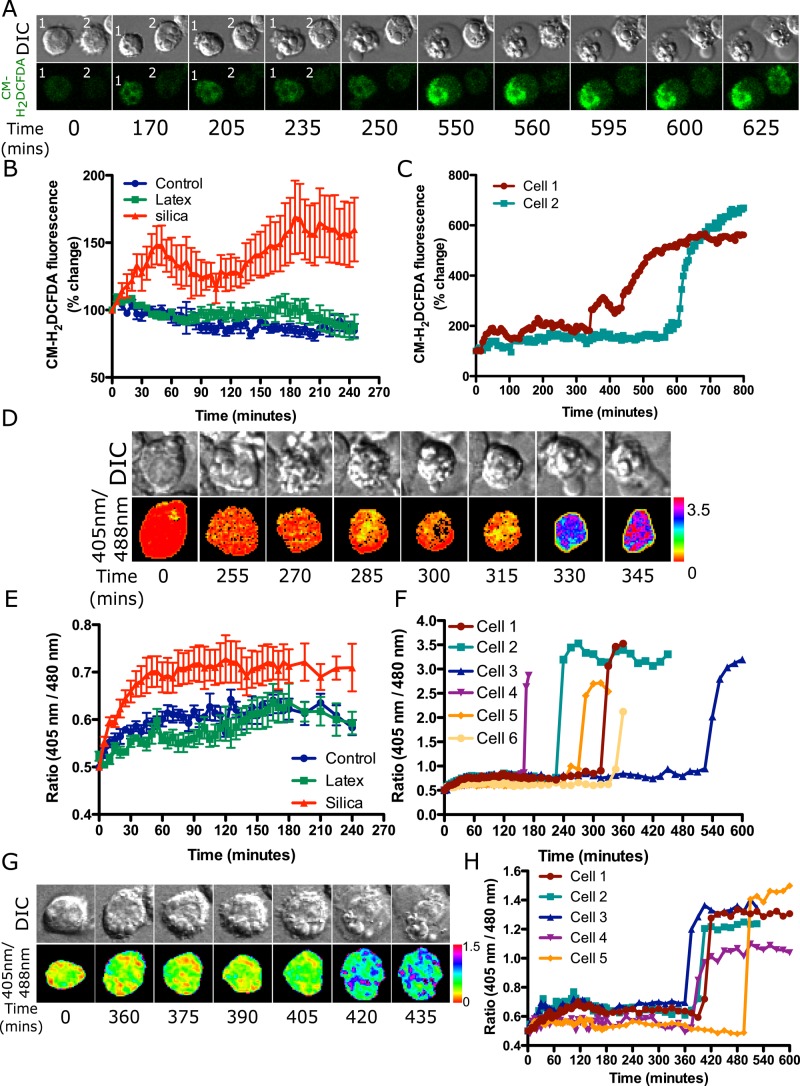
FIGURE 8:
Cytoplasmic ROS is detected in MH-S cells exposed to silica but not latex particles. MH-S cells were plated in an eight-well chambered slide and labeled with 10 μM CM-H2DCFDA, and four fields per well were imaged 5 min apart after exposure to either opsonized silica particles or latex particles (A–C). (A) A small increase in fluorescence is observed over time in cells 1 and 2 upon particle addition, which remains constant up to 250 min for cell 1 and 600 min for cell 2 (quantified in C). A further increase in fluorescence is observed after cell blebbing during secondary necrosis (cell swelling) at 550 min for cell 1 and 625 min for cell 2. (B) Comparison of the change in CM-H2DCFDA fluorescence in control cells and upon exposure to latex or silica particles showing that only silica results in the generation of measurable cytoplasmic ROS. Data represent the mean ± SEM of at least 10 individual cells for each treatment type. (C) Quantification for cells 1 and 2 in A showing a small increase in fluorescence after particle addition as opposed to the huge increase in ROS generation during cell death. (D–F) To detect specifically H2O2 in cells, MH-S cells expressing roGFP2-Orp1 were exposed to either opsonized silica or latex particles and imaged at 5-min intervals. (D) A small increase in roGFP2 ratio is observed in first hour; however, this cannot be represented in the ratiometric images. After cell blebbing, a huge change in roGFP2 ratio is observed at 330 min. (E) Comparison of the change in roGFP2-Orp1 ratio in control cells and upon exposure to latex or silica particles showing that only silica results in the generation of measurable cytoplasmic H2O2. Data represent mean ± SEM of at least 10 individual cells for each treatment type. (F) Quantification for the cell in D is represented by cell 1, and other cells are represented as 2–6. All of these cells show a huge increase in ratio at different time points, which relates to cell death. (G) To detect mitochondrial H2O2, MH-S cells expressing mito-roGFP2-Orp1 were exposed to opsonized silica particles. In pseudocolored ratiometric images, mitochondria appear red to yellow, indicative of basal H2O2, whereas upon secondary necrosis, there is an increase in H2O2 from 420 min onward; mitochondria appear blue to pink. (H) Quantification of cell represented in G, cell 1. Other cells show a similar trend, with a huge increase in ratio observed during secondary necrosis after 350 min.

