FIGURE 4:
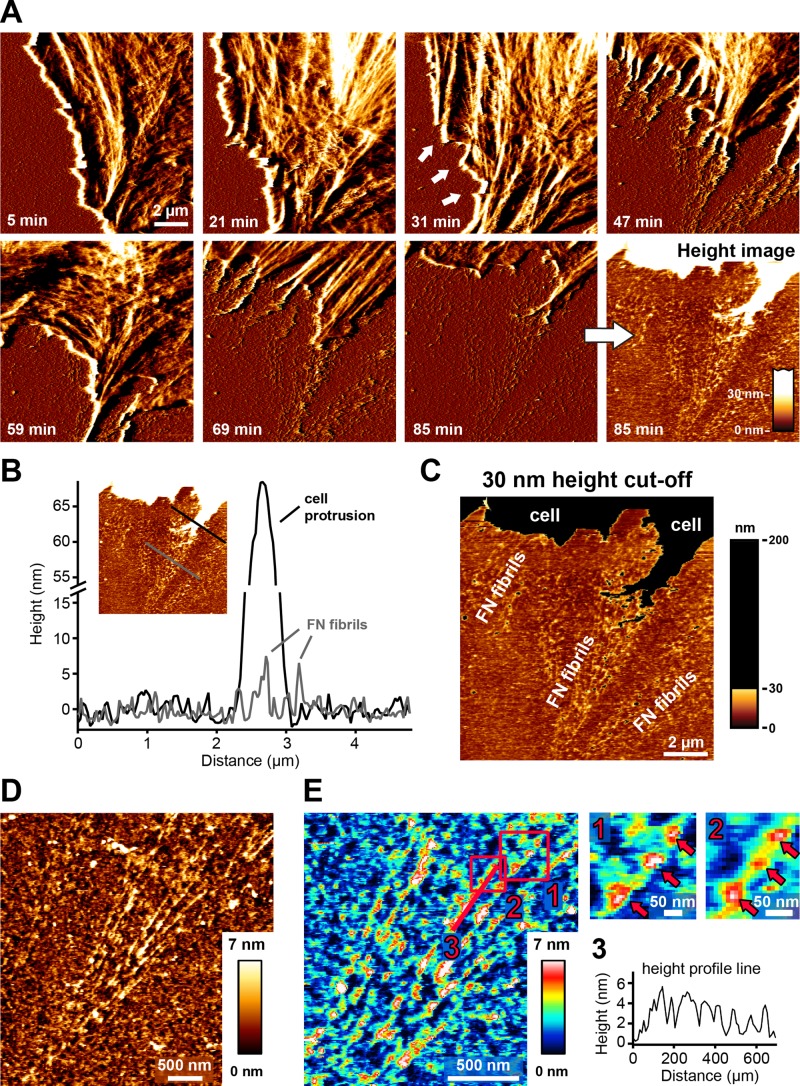
Investigating FN fibrillogenesis by time-lapse AFM in living cells. Suspended REF52 cells were added to FN-coated mica substrates. After 5–10 min of cell spreading, ∼10 × 10 μm2 regions near the cell periphery were scanned continuously by AFM in contact mode. (A) Time-lapse images (deflection channel) of a region at the cell edge. The cell membrane initially protrudes (21 min), but after 31 min, it starts retracting, and FN fibrils appear (white arrows). After several cycles of extension and retraction, the cell membrane finally retracts fully from the imaging area (85 min), revealing an array of FN fibrils (deflection and corresponding height images). The complete time-lapse series is presented in Supplemental Movie S1. (B) Height profile lines generated across a newly formed array of cell-induced FN fibrils (gray line) or across cellular retraction structures (black line). FN fibrils and cellular structures can be distinguished based on their different height profiles. (C) AFM height image to which a 30-nm height cut-off has been applied to isolate FN nanofibrils. (D) High-resolution AFM scan revealing the linear ultrastructure of cell-induced FN nanofibrils. (E) Part of the AFM height image shown in D in a rainbow color scale (left). Pink squares indicate two regions shown at higher magnification on the right. The pink line indicates the position of a height profile shown on the lower right. Pink arrows indicate periodic features on cell-induced FN fibrils.

