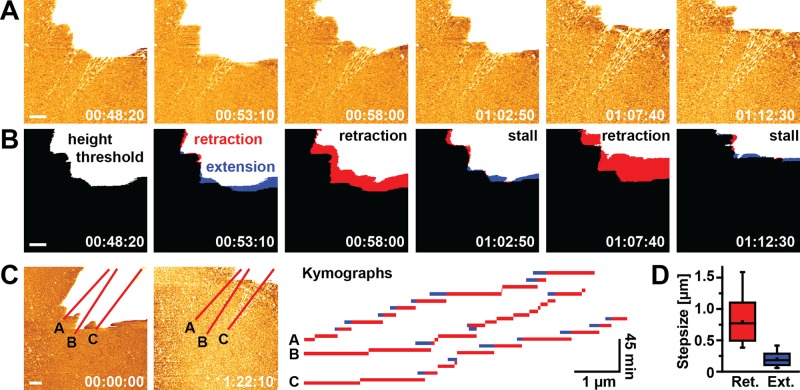
FIGURE 7:
Stepwise formation of FN nanofibrils. (A) Several consecutive image frames from an AFM time-lapse series visualizing the formation of FN nanofibrils during membrane retraction of a single cell (top right corner). AFM images were obtained every 290 s. The height scale was adjusted to best visualize newly formed FN nanofibrils, which uniformly allocated the cell body the maximum height scale value (white). (B) Applying a height threshold (>20 nm) to the AFM topographs generated binary images, from which the membrane spread area could be determined. Differential superimposition of two consecutive thresholded image frames identifies areas of membrane retraction (red) or extension (blue). (C) Kymographs generated along three lines across the entire time-lapse movie (total duration 82 min) to visualize the step-like extension patterns of FN nanofibrils. Bars indicate membrane retraction events, and blue segments indicate transient membrane extension relative to the preceding frame. Gaps in the time traces indicate absence of net membrane movement. (D) Quantification of retraction (Ret.) and extension (Ext.) step sizes from the kymographs shown in C. Scale bars 1 μm.

