
FIGURE 5:
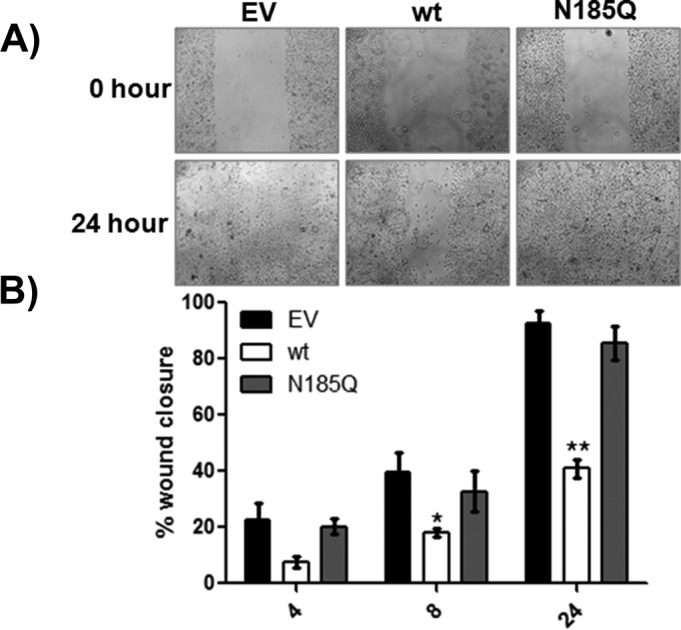
N-glycosylation controls JAM-A–mediated decrease in wound closure. CHO cells expressing EV or wt or N185Q JAM-A were grown to confluence on FN-coated glass-bottom dishes. A wound was made across the entire length of the glass insert using the tip of a 200-μl pipette tip, and closure was assessed over a 24-h period. (A) Representative micrographs at the beginning (0 h) and end (24 h) of an experiment. (B) Quantitation of wound closure. Five separate regions from each dish were monitored for closure. Data presented are the average ± SEM of the five regions from one dish and are representative of four separate experiments. Statistical differences were determined by one-way ANOVA with Tukey’s posttest. *p < 0.05 vs. EV; **p < 0.05 vs. EV and N185Q.