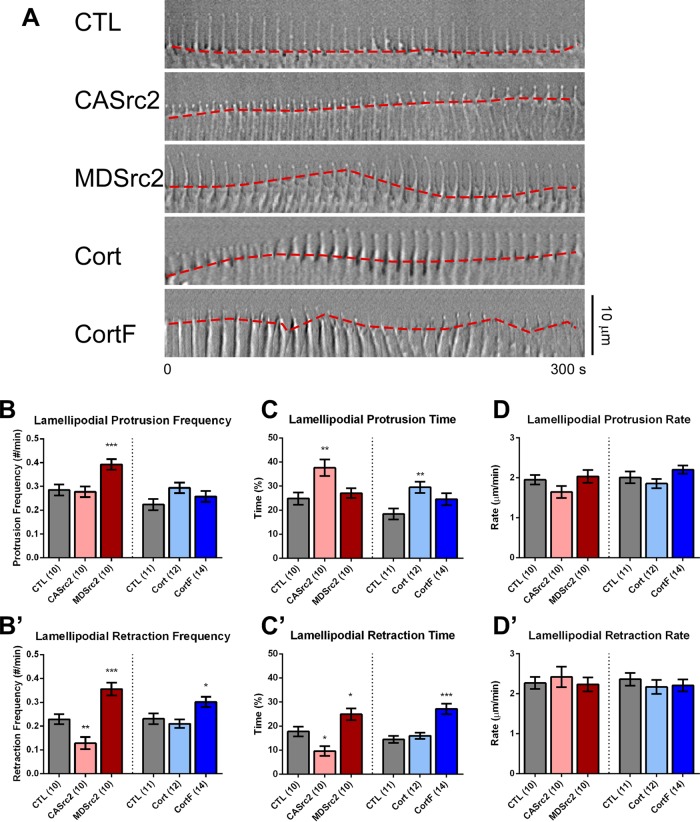
FIGURE 2:
Src2 and cortactin positively regulate lamellipodial protrusion persistence. (A) DIC montages of 5-min time-lapse recordings at 10-s intervals showing lamellipodial leading-edge dynamics (red dashed line) in control growth cones or after expression of CASrc2, MDSrc2, cortactin, or CortF. Scale bar as indicated. (B, B′) Respective protrusion and retraction frequencies of lamellipodia. (C, C′) Respective average percentages of time lamellipodia spent in protrusion and retraction phases. (D, D′) Respective average lamellipodial protrusion and retraction rates. Mean values ± SEM. Numbers in parentheses are number of growth cones selected from at least three experiments. One-way ANOVA with Dunnett’s post hoc test was separately performed for Src2 and cortactin conditions; *p < 0.05, **p < 0.01, ***p < 0.001.

