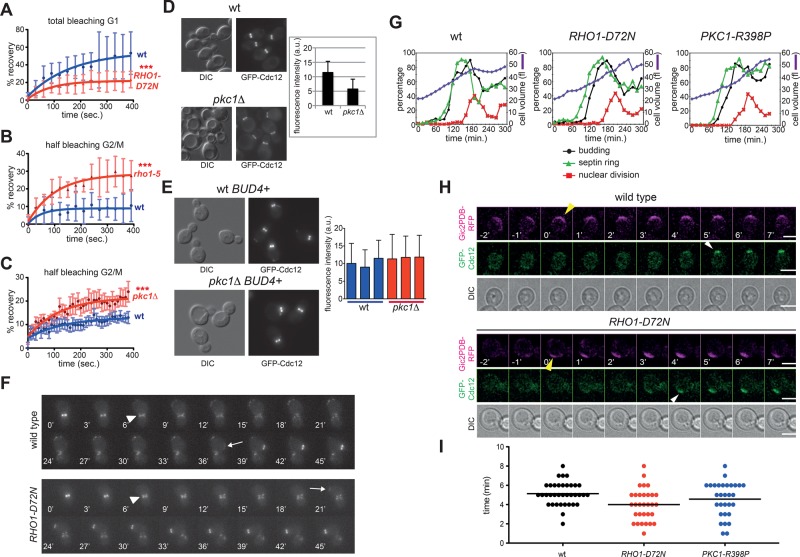
FIGURE 3:
RHO1 and PKC1 mutations affect septin dynamics. (A) FRAP analysis of the septin ring in G1 cells after complete bleaching of the GFP-Cdc12 fluorescence signal at the presumptive bud site (time 0: postbleach). (B, C) FRAP analysis of the septin ring in budded cells after bleaching of half of the GFP-Cdc12 fluorescence signal at the bud neck (time 0: postbleach). Curves were fitted to monoexponential decay. (D) Wild-type and pkc1Δ cells in the W303 background (bud4) were grown in sorbitol-containing YEPD medium at 30°C and imaged. Fluorescence intensities of GFP-Cdc12 signals at the bud neck were quantified on one single in-focus plane (n ≥ 100). (E) Three independent wild-type and pkc1Δ strains in W303 carrying a wild-type copy of BUD4 (BUD4+) were grown and imaged as in D to quantify fluorescence intensities of GFP-Cdc12 signals at the bud neck (n ≥ 100). (F) Representative movies of wild-type and RHO1-D72N cells expressing GFP-Cdc12. Arrowheads indicate splitting of the septin ring, whereas arrows indicate appearance of a new septin ring. Time 0 is arbitrarily set 6 min before septin ring splitting. (G) Small, unbudded cells of wild-type, RHO1-D72N, and PKC1-R398P cells were isolated by centrifugal elutriation and released in fresh YEPD medium at 25°C (time 0). At the indicated time points, cells were collected for FACS analysis of DNA contents (not shown) and kinetics of cell volume, budding, nuclear division, and septin ring formation. This last was analyzed by indirect immunofluorescence with anti-Cdc11 antibodies. (H, I) Wild-type, RHO1-D72N, and PKC1-R398P cells expressing GFP-Cdc12 and the Gic2PDB-RFP marker of Cdc42 activation were filmed at 30°C to measure the time interval between Cdc42 activation and septin recruitment. The graph (I) represents the distribution of time intervals in each strain (n ≥ 30) and mean times (black bars).

