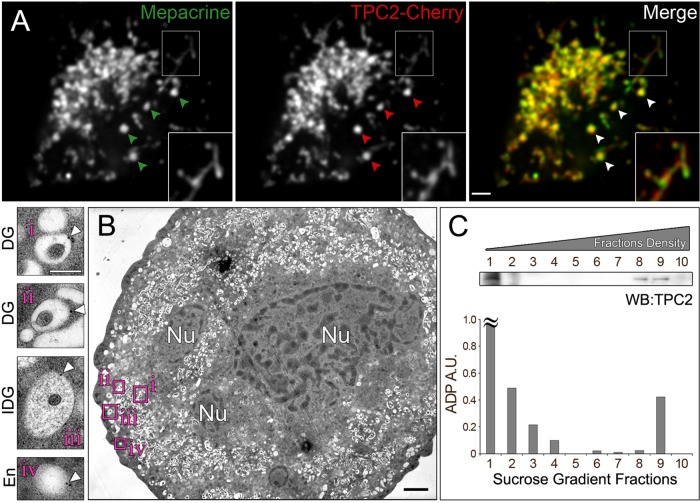
FIGURE 2:
TPC2 localizes to PDGs in primary MKs. (A) Spinning-disk confocal fluorescence microscopy images of a live primary bone marrow MK expressing TPC2-Cherry and incubated with the PDG-specific green fluorescent dye mepacrine. Bar, 5 μm. Inset, magnified view of the indicated region showing PDGs connected by tubules. (B) Thin-section immunogold electron micrograph of a primary MK labeled with the chicken TPC2-C antibody (7000×). Insets (15,000×), examples of mature PDGs (i, ii), immature PDG (iii), and endosome (iv). White arrowheads indicate gold particles. Black bar, 2 μm; white bar, 250 nm. Nu, nucleus. See also Supplemental Figure S3. (C) Subcellular fractionation of primary MKs. The postnuclear supernatant of a primary MK extract was subjected to a 10–60% linear sucrose gradient fractionation. Fractions obtained were analyzed for their ADP content and immunoblotting with a rabbit anti-TPC2 antibody. ≈, out of scale.

