FIGURE 3:
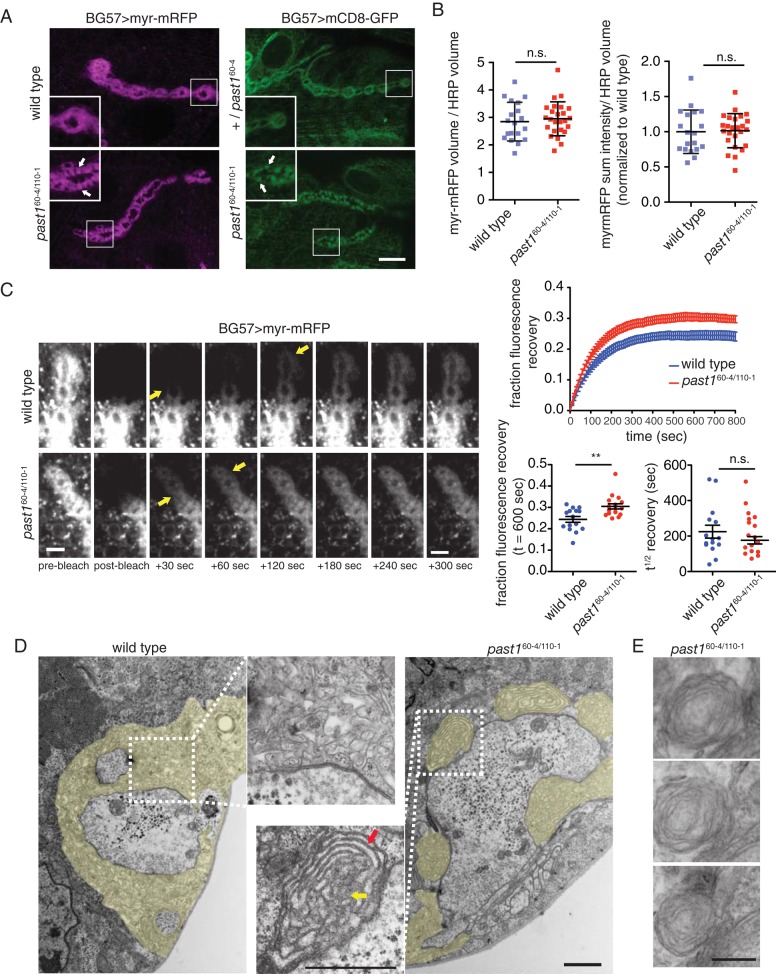
Postsynaptic membrane organization is altered in past1 mutants. (A) Third-instar larval NMJ expressing myr-mRFP or mCD8-GFP under the control of BG57-GAL4. Images and insets show a single 100× spinning-disk confocal slice from muscle 4, segment A3. Arrows indicate postsynaptic foci. Scale bar, 10 μm. (B) Quantifications of myr-mRFP sum intensity and volume relative to HRP-labeled neuronal arbor volume. (C) Time-lapse of representative FRAP analysis of myr-mRFP turnover in wild-type and mutant larvae. A single spinning-disk 60× confocal slice from muscle 4, segment A3/A4, is shown. Arrows indicate progressive recovery of fluorescence from proximal to distal boutons. Scale bar, 5 μm. Quantification of FRAP recovery. (D) TEM of NMJs from wild-type and past1-mutant larvae. SSR is highlighted in yellow; red arrow indicates membrane sheets, and yellow arrow indicates membrane core. Scale bar, 1 μm. (E) past1-mutant NMJs exhibit membrane sheets. Three ∼70-nm serial sections from a past1-mutant NMJ. Scale bar, 250 nm.

