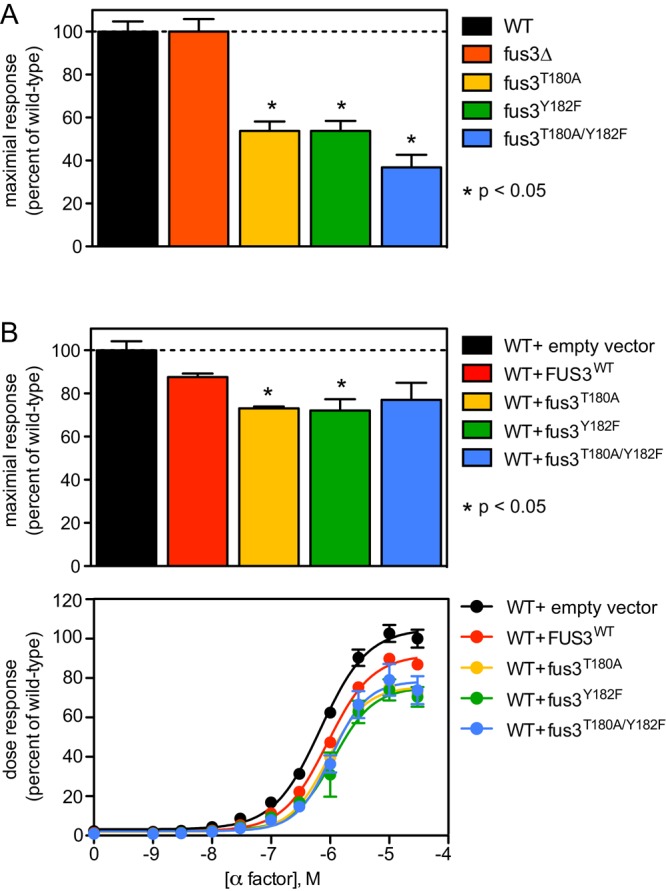
FIGURE 1:

Signal inhibition by monophosphorylated Fus3. (A) Transcription reporter (FUS1-lacZ) activity in wild-type (WT), Fus3-deficient, or Fus3 activation loop mutant strains (fus3T180A, fus3Y182F, and combined fus3T180A/Y182F) stimulated with 10 μM α-factor. (B) Same analysis in wild-type cells bearing a single-copy plasmid with no insert (vector), wild-type FUS3, or mutations in the Fus3 activation loop. FUS1-lacZ data are presented as a percentage of maximum activity in wild-type cells (A and B, top) and as a full dose–response curve (B, bottom). Results report ±SEM (n = 3) for each data point, but this is not visible in every case. *Statistically significant Student’s t test of pairwise comparisons for wild type and the individual mutants.
