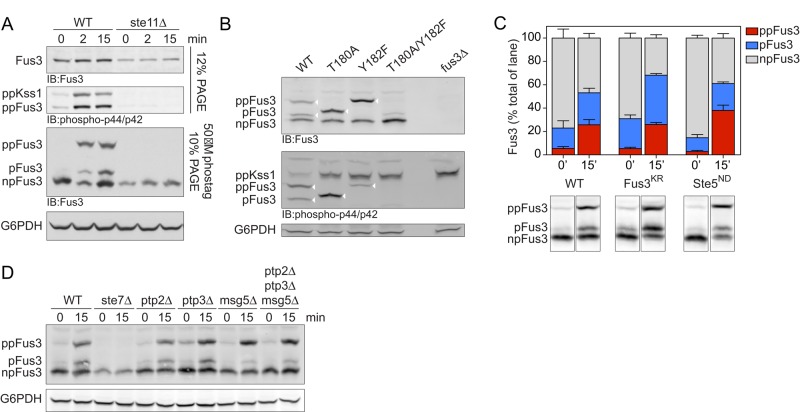
FIGURE 2:
Analysis of differentially phosphorylated forms of Fus3. (A) Wild-type or ste11Δ (MAPKK) mutant cells untreated (0) or treated for 2 or 15 min with 10 μM α-factor were lysed and resolved by immunoblotting after SDS–PAGE and probed with Fus3 antibodies (top) or p44/p42 antibodies (top middle), with Phos-tag reagent and probed with Fus3 antibodies (bottom middle), or with G6PDH load control antibodies (bottom). Bands represent the dual-phosphorylated (ppKss1, ppFus3), monophosphorylated (pFus3), nonphosphorylated (npFus3), and total (Fus3) protein. Except for the topmost panel, this and all subsequent experiments were done using Phos-tag. (B) Wild-type, Fus3 activation loop (T180A, Y182F), and fus3Δ mutants were resolved by Phos-tag SDS–PAGE and immunoblotting with Fus3 antibodies (top), p44/p42 antibodies (middle), or G6PDH load control antibodies (bottom). Arrowheads indicate the bands of interest (i.e., those recognized by p44/42 antibodies). (C) Wild-type, fus3KR (catalytically inactive), and ste5ND (nondocking) mutants untreated or treated for 15 min with 10 μM α-factor were resolved by Phos-tag SDS–PAGE and immunoblotted with Fus3 antibodies. Representative data are shown below. Band intensity was quantified as a percentage of total Fus3 in each lane. Results are reported as ±SEM (n ≥ 3). (D) Wild-type, ste7Δ, and phosphatase-deficient ptp2Δ, ptp3Δ, and msg5Δ mutants, alone or in combination, were resolved by Phos-tag SDS–PAGE and immunoblotted with Fus3 antibodies (top) or G6PDH load control antibodies (bottom).

