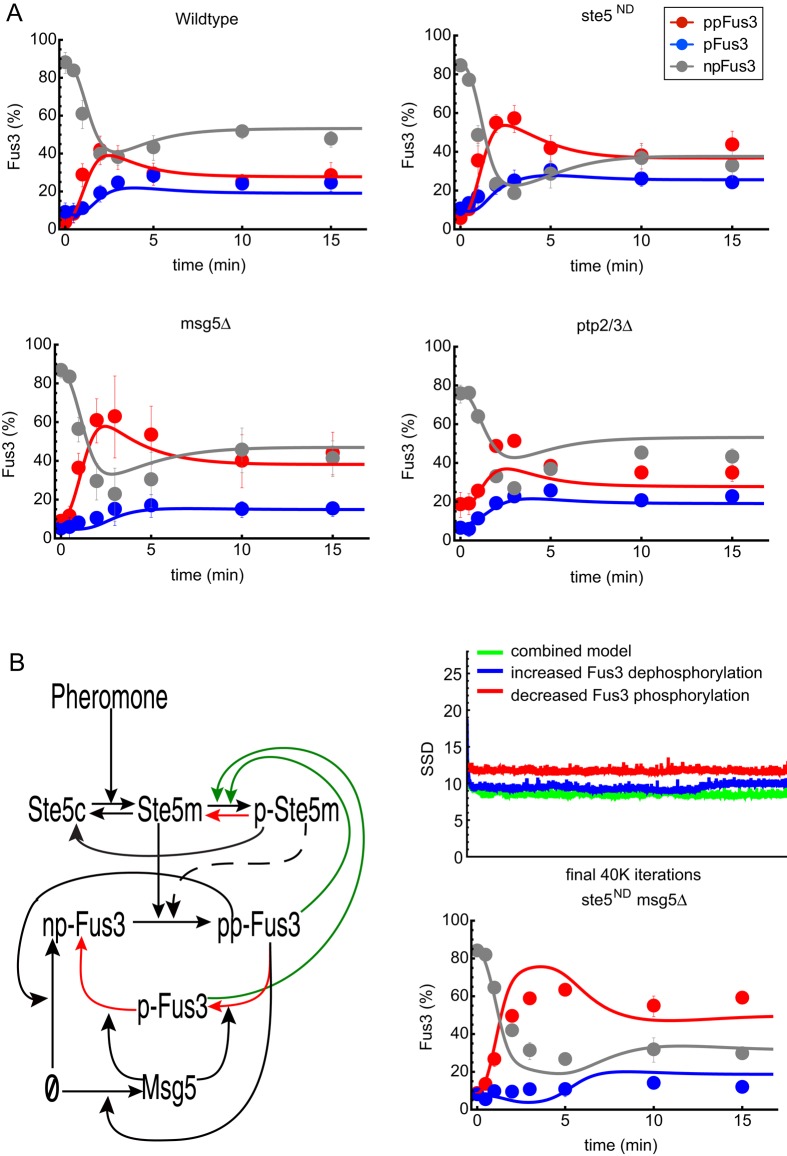
FIGURE 4:
Dynamics and mathematical model of the differentially phosphorylated forms of Fus3. (A) Time series for wild-type (top left), ste5ND (nondocking) mutant (top right), msg5Δ (bottom left), and ptp2Δ/ptp3Δ (bottom right) cells treated with 10 μM α-factor and resolved by Phos-tag SDS–PAGE and immunoblotting with Fus3 antibodies. Dual-phosphorylated (ppFus3), monophosphorylated (pFus3), and nonphosphorylated (npFus3) quantified as a percentage of total Fus3. Results are reported as ±SEM (n ≥ 3). Circles are experimental results. Lines are simulation results of the mathematical model shown in B. (B) Left, diagram of the mathematical models. Black lines represent pathway components present in all models. The dashed line is included in the model in which feedback-phosphorylated Ste5 (pSte5) limits Fus3 phosphorylation (activation), and the red lines are included in the model in which feedback-phosphorylated Ste5 increases Fus3 dephosphorylation (deactivation). The combined model includes both effects. Top right, performance of all three models. This graph shows values for the sum of squared deviations (SSDs) for the 39,000 best parameter sets found by the Monte Carlo algorithm for parameter estimation. Bottom right, model predictions for the combined model and corresponding experimental results for the ste5ND msg5Δ double mutant.

