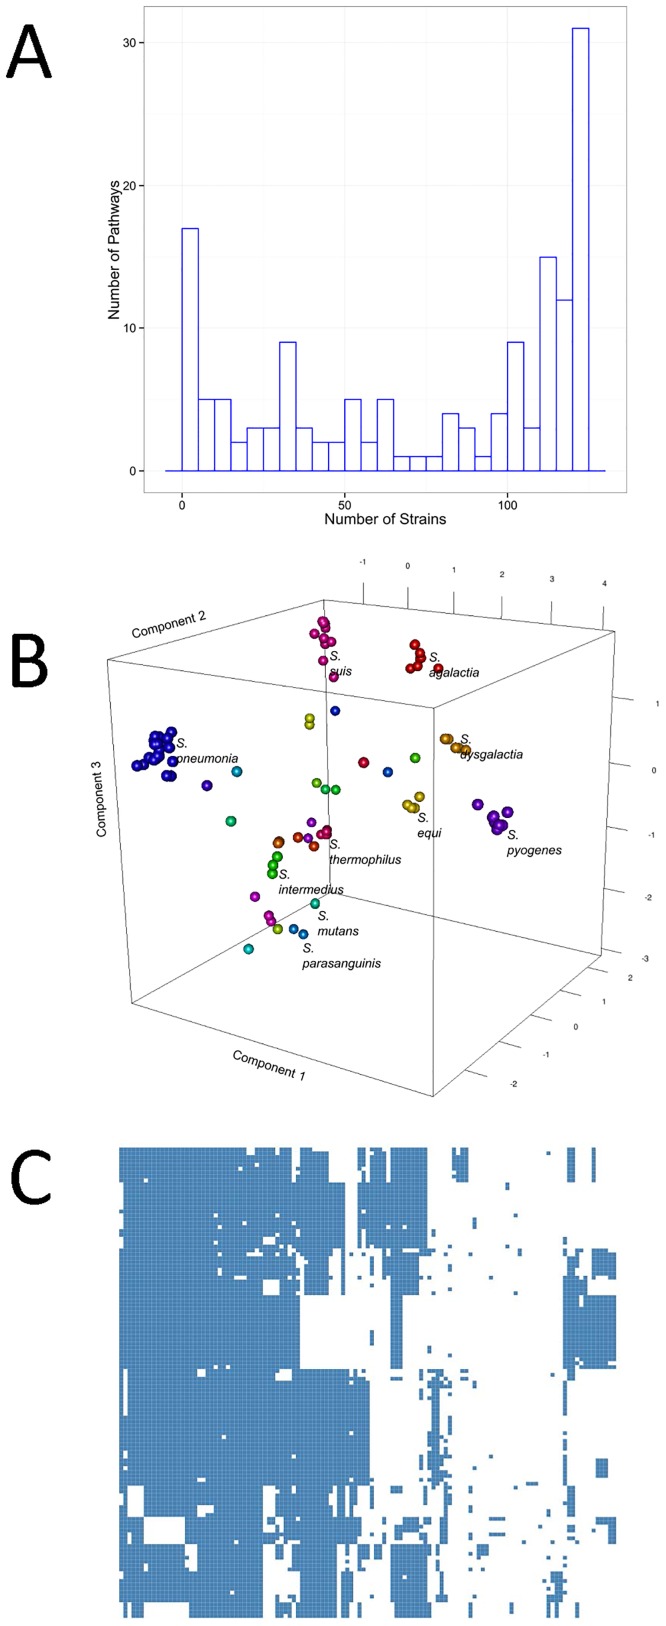
Fig 3.
A) Distribution of functional pathways across different strains B) Score plot of principal component analysis performed on the metabolic diversity matrix. C) Hierarchical clustering performed on the metabolic diversity matrix. Strains cluster on the basis of their capability of performing certain metabolic functions.

