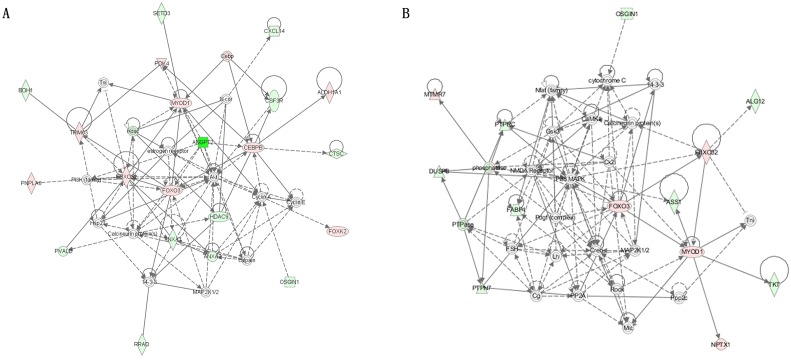
Fig 3. Gene networks involved the FBXO32 and MYOD1 in WRRh Vs. XHh and WRRl Vs. XHl.
A: in WRRh Vs. XHh. B: in WRRl Vs. XHl. Genes exhibiting up-regulated were shown in red, while gene exhibiting down-regulated were shown in green color. The color intensity indicated the degree of up-/down-regulated. Solid lines and dashed lines indicated direct interaction and indirect interaction, respectively.

