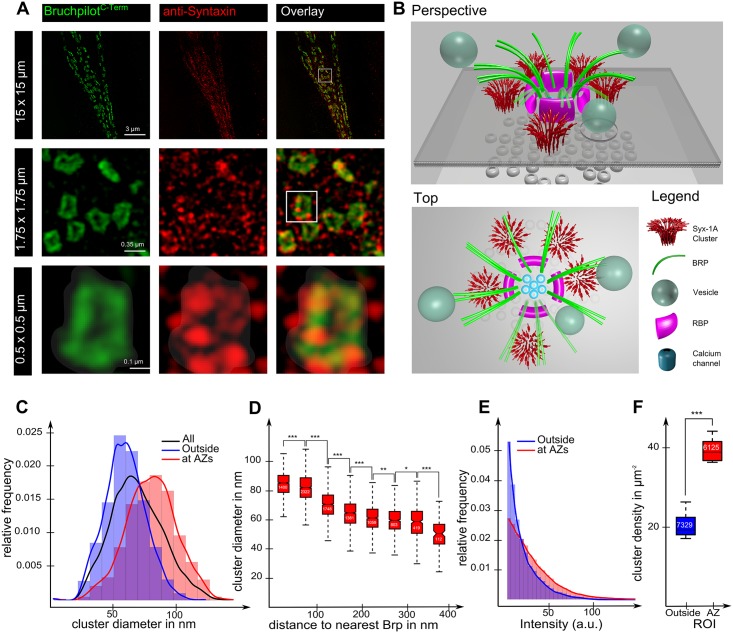
Fig 1. Syntaxin 1A forms larger clusters at active zones.
(A) STED images of a Drosophila neuromuscular junction (NMJ), co-stained for Bruchpilot (left, green) andSyntaxin-1A (middle, red), and their overlay (right). Top row (15 μm x 15 μm): Syntaxin-1A is abundant over the entire NMJ and Bruchpilot forms ring-like structures. The middle row (1.75 μm x 1.75 μm): zoom showing seven active zones indicated by the Bruchpilot rings. Syntaxin-1A appears in patchy structures identifying clusters. Bottom row (0.5 μm x 0.5 μm): zoom showing one Bruchpilot ring. Syntaxin-1A micro-domains situated beneath or near the Bruchpilot ring structure. The active zone region as defined here is shown as shaded region. (B) Illustration of an active zone model showing the Bruchpilot and Syntaxin-1A cluster positions as observed in the STED images. (C) Analysis of the Syntaxin-1A cluster size with respect to their position towards the active zone. The cluster size distribution of identified Syntaxin-1A clusters, with cluster sizes defined by the diameter of the full width half maximum area. The distribution for whole NMJs (All) as well as the distributions in Syntaxin-1A clusters at (at AZ) and outside of active zones (Outside) are shown. (D) Syntaxin cluster size as a function of their distance to the nearest active zone (BRP ring structure). Boxplots show the median and distribution of cluster sizes for 8 distance ranges. Asterisks indicate degree of statistical significance and are inferred from the probability (P-Value) of the difference in means using a T-test, * = P<0.05, ** = P<0.01, *** = P<0.001. Asterisks are attached to bars which indicate the corresponding pair being compared in the T-test. Notches indicate 95% confidence interval for the median. The number of clusters within a specific range is shown inside the boxplot. (E) The fluorescence intensity of Syntaxin (red channel) for active zones (green channel intensity above zero) and outside active zones. (F) The density of clusters at the active zone compared with that outside of active zones. The number of clusters for a specific location is shown inside the boxplot.

