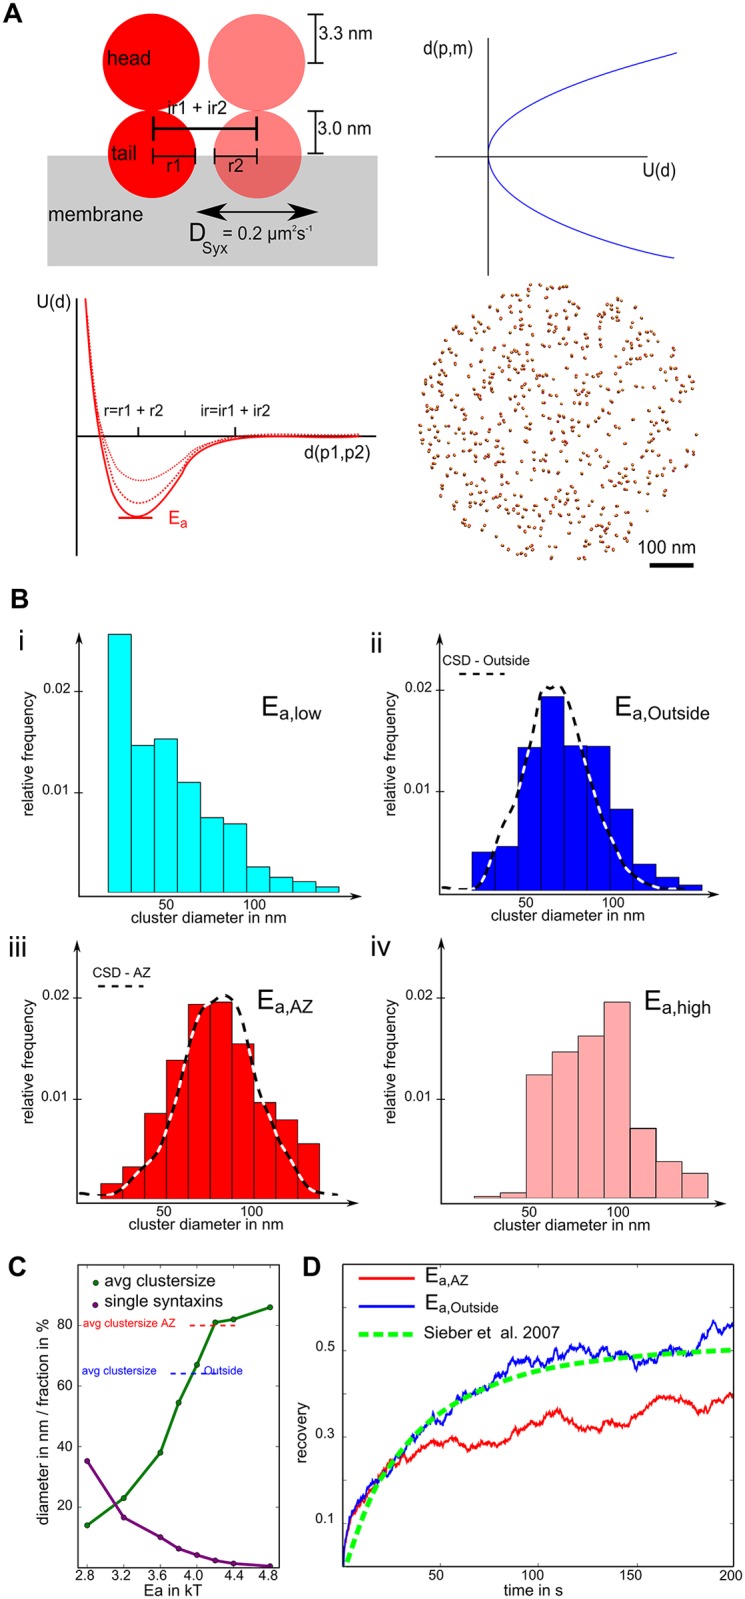
Fig 2. Computational model of Syntaxin-1A reproduces experimental results.

(A) Schematic presentation of the computational model of Syntaxin-1A cluster formation. The ReaDDy two-particle model of Syntaxin (top left) with the “membrane” potential profile (top right) and the SNARE-SNARE attraction/clustering potential (bottom left) and the starting topology of 500 Syntaxins on a circular area with 300 nm radius (bottom right). (B) Cluster size distributions for different potential well depths (i-iv) show strong differences in the clustering behavior. The simulated cluster size distributions for the two potential parameters Ea,Outside (ii) and Ea,AZ (iii) correspond well to the experimental cluster size distributions found outside (CSD-Outside) and at active zones (CSD-AZ) shown as dashed lines in ii and iii, respectively. (C) Line-plot showing the average cluster size and the fraction of “single” syntaxins with respect to the potential strength parameter Ea, also indicated are average cluster size of active zone and outside region from the experimental STED data (dashed lines). (D) Recovery curves of simulated FRAP experiments for the two selected potential strengths compared with experimentally derived FRAP curve from Fig 4B in Sieber et al.[6].
