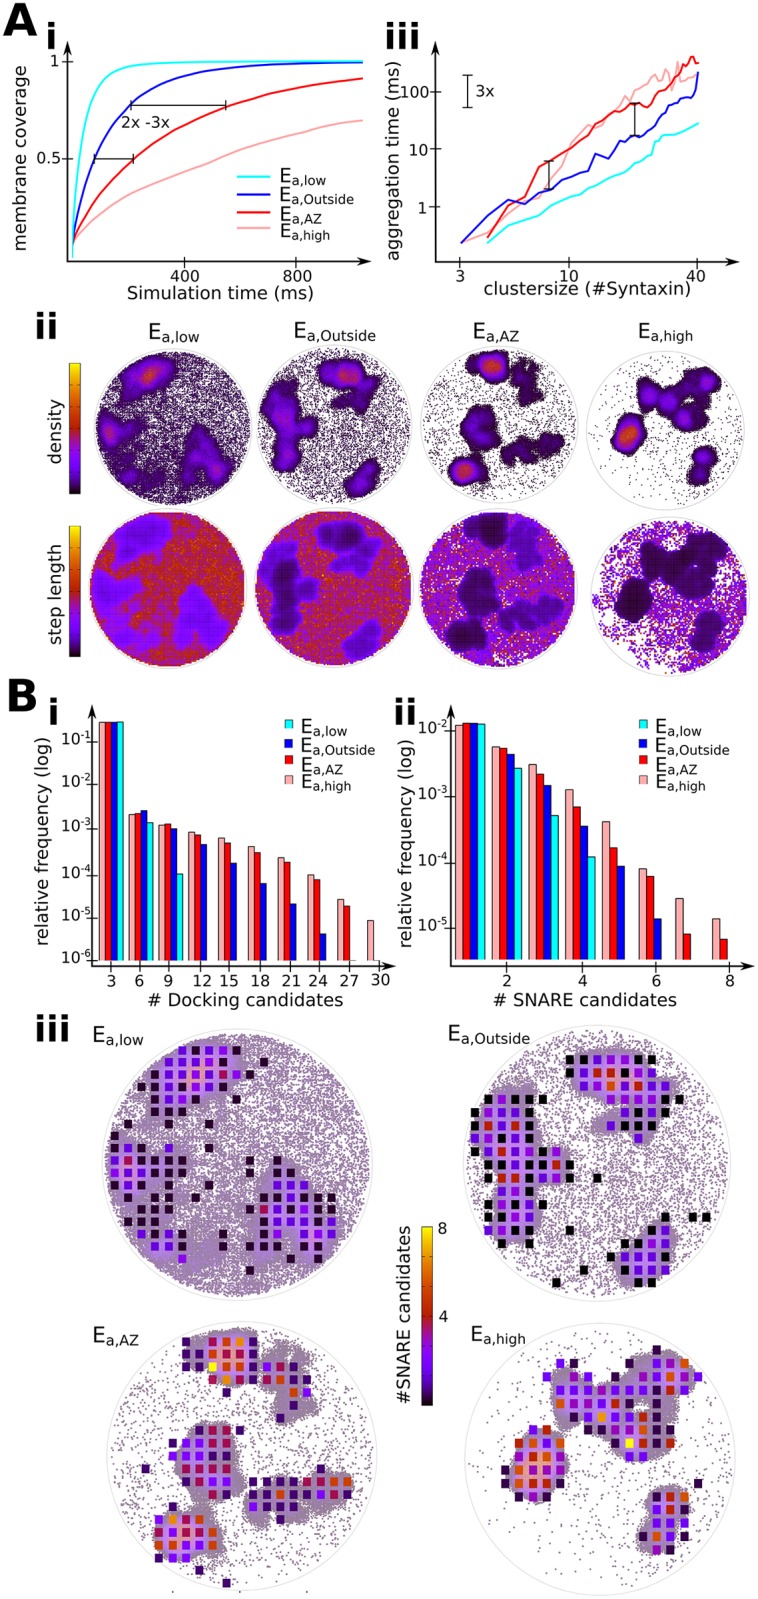
Fig 4. The differences in Syntaxin-1A mobility and cluster dynamics explain Syntaxin cluster function at specific locations.

(A) Lower degree of clustering allows faster membrane exploration and aggregation at target sites. i) Progress of membrane coverage (percentage of visited area). ii) Density plots (upper row) and step length plots (lower row) of one sample simulation run for four different degrees of clustering. iii) The aggregation time of clusters at a newly formed target site as a function of cluster size. (B) Higher degree of clustering enables the formation of more SNARE complexes leading to higher fusion probability. i) Histogram of docking candidates, i.e. the number of all Syntaxin particles in a vesicle-sized area. ii) Histogram of SNARE candidates, i.e. the number of free Syntaxin particles and Syntaxins on the cluster rim. Candidates are tracked in an area with the size of a synaptic vesicle. iii) Positions of SNARE candidates superimposed on density plots. Areas with many SNARE candidates are at the periphery of clusters.
