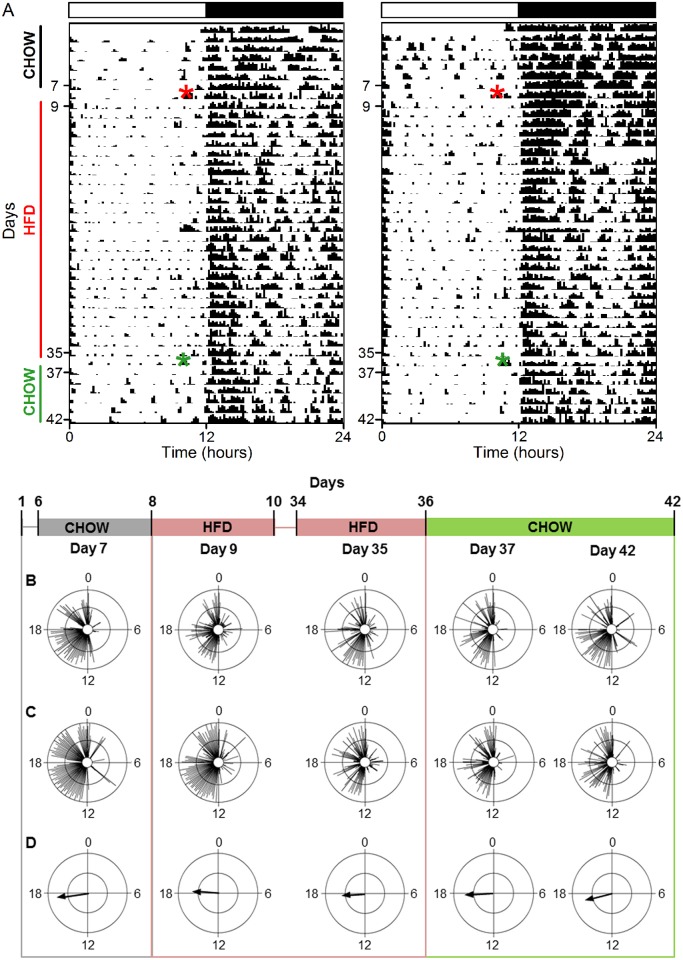
Fig 5. The reversibility of high-fat diet disruption of locomotor activity rhythms is variable.
A. Representative actograms of locomotor activity plotted in 10-min bins. Chow was replaced with high-fat diet (HFD; red asterisk) on day 8 and HFD was replaced with chow (green asterisk) on day 36. B, C. Representative circular histograms of activity (10-min bins) in 2 individual mice during one day of chow (day 7), 4 weeks of HFD consumption (days 9, 35), and upon return to chow (days 37, 42). Scale: inner circle, 0; middle circle, 5; outer circle, 10. C. Grand mean vectors of locomotor activity (n = 5). Scale: inner circle, 0; middle circle, 0.3; outer circle, 0.6. Lights were on from 0–12. Circular statistics are shown in Table 2.

